A crucial but often overlooked consideration when working with data is: what is the best way to organise it? The way we organise our data can change not only how we interact with it, but also our mental model of that data. A well-designed database should efficiently organise both the data that we have now, as well as the data we expect to have in the future. At DSSG this summer, teams ‘Charlotte‘, working with the Charlotte-Mecklenburg Police Department, and ‘Nashville‘, working with the Metro Nashville Police Department, have been pooling their efforts to design a data system that is as logical, practical, and future-proof as possible.
The two teams are in a unique position this year among DSSG projects: they are both trying to solve the same problem, albeit in two different cities. As part of the White House Police Data Initiative, both are building early intervention systems for police departments. These intervention systems will flag officers who are at risk of adverse interactions with the public, so that departments can intercede before these incidents occur. Possible interventions could include extra training, counseling or time off work.
![]()

Team Charlotte is continuing work with the department that began with DSSG last year, whereas Team Nashville is replicating the project afresh in Tennessee. Since both teams share the same broad goal, but are working with different datasets, this overlap provides a unique opportunity for close collaboration between two different DSSG projects.
An overarching goal of both the Charlotte and Nashville projects is not to run bespoke analyses for each department, but to create a general system that can be rolled out to other departments in the future. A replicable ‘cookie-cutter’ system like this could benefit many more departments across the country, and so have a much greater impact.
However, this kind of system is also initially much more challenging to design and build. Such a system needs the data from any participating police department to be massaged into a common structure. Once it is in this common structure, the next stage of generating multiple machine learning models can be automated.
Unfortunately, there is no mutually agreed-upon format for police department internal data. Both Nashville and Charlotte teams have access to different kinds of data, in different formats, structured in different ways. In order to have a shared system, both teams would have to agree on a universal database layout for both of their datasets.
For a day last week, the fellows and mentors for the Nashville and Charlotte teams did just that: they locked themselves in a conference room for most of the day to design a common database structure. Since we are hoping that the initiative will grow and become better established in subsequent years, the design decisions that we made at this stage were very important; any future work would be building off this system. The information we chose to keep could even act as a guide for other police departments as to what data they should start collecting.
With this in mind, we decided not to revisit the data format that the Charlotte team last year had used, but to design a system from scratch. We also decided that we wouldn’t limit ourselves to the data that Charlotte and Nashville police departments provided to us this summer. Instead, we’d design our ideal world database, even if it meant leaving some columns or tables blank where we didn’t actually have data. Coming from academia, this deliberate design phase was new and strangely satisfying to most of us fellows.
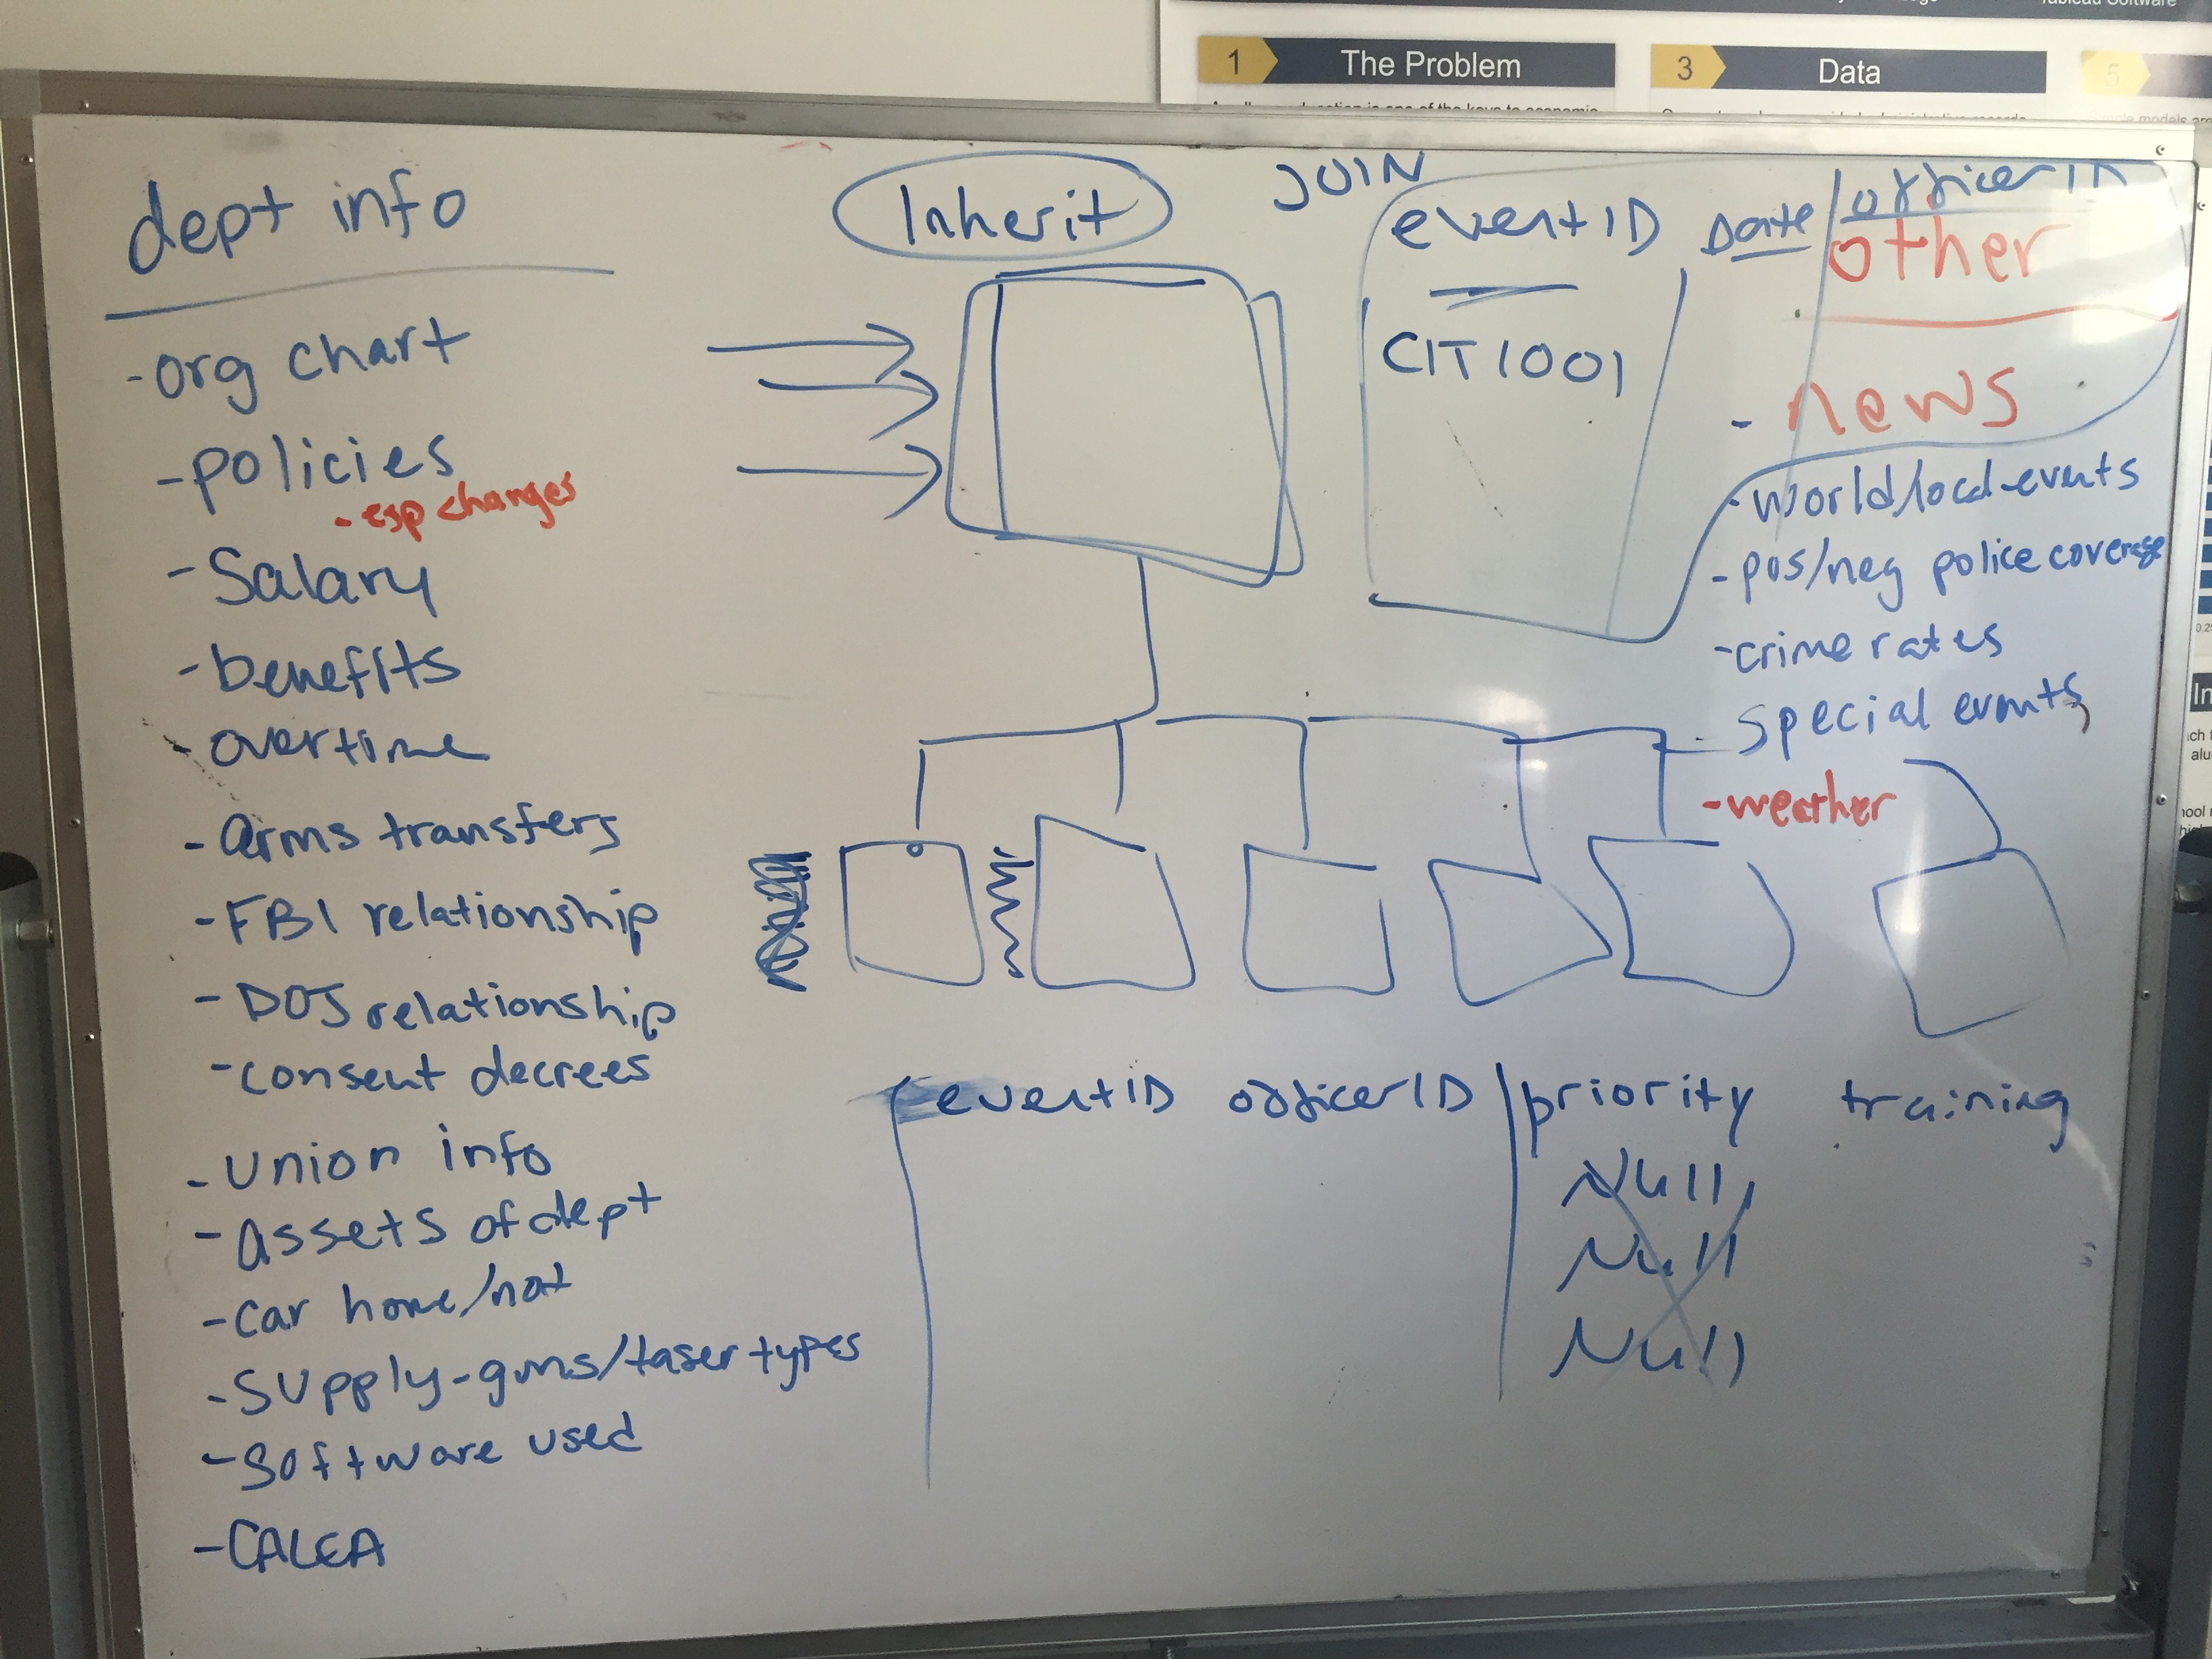
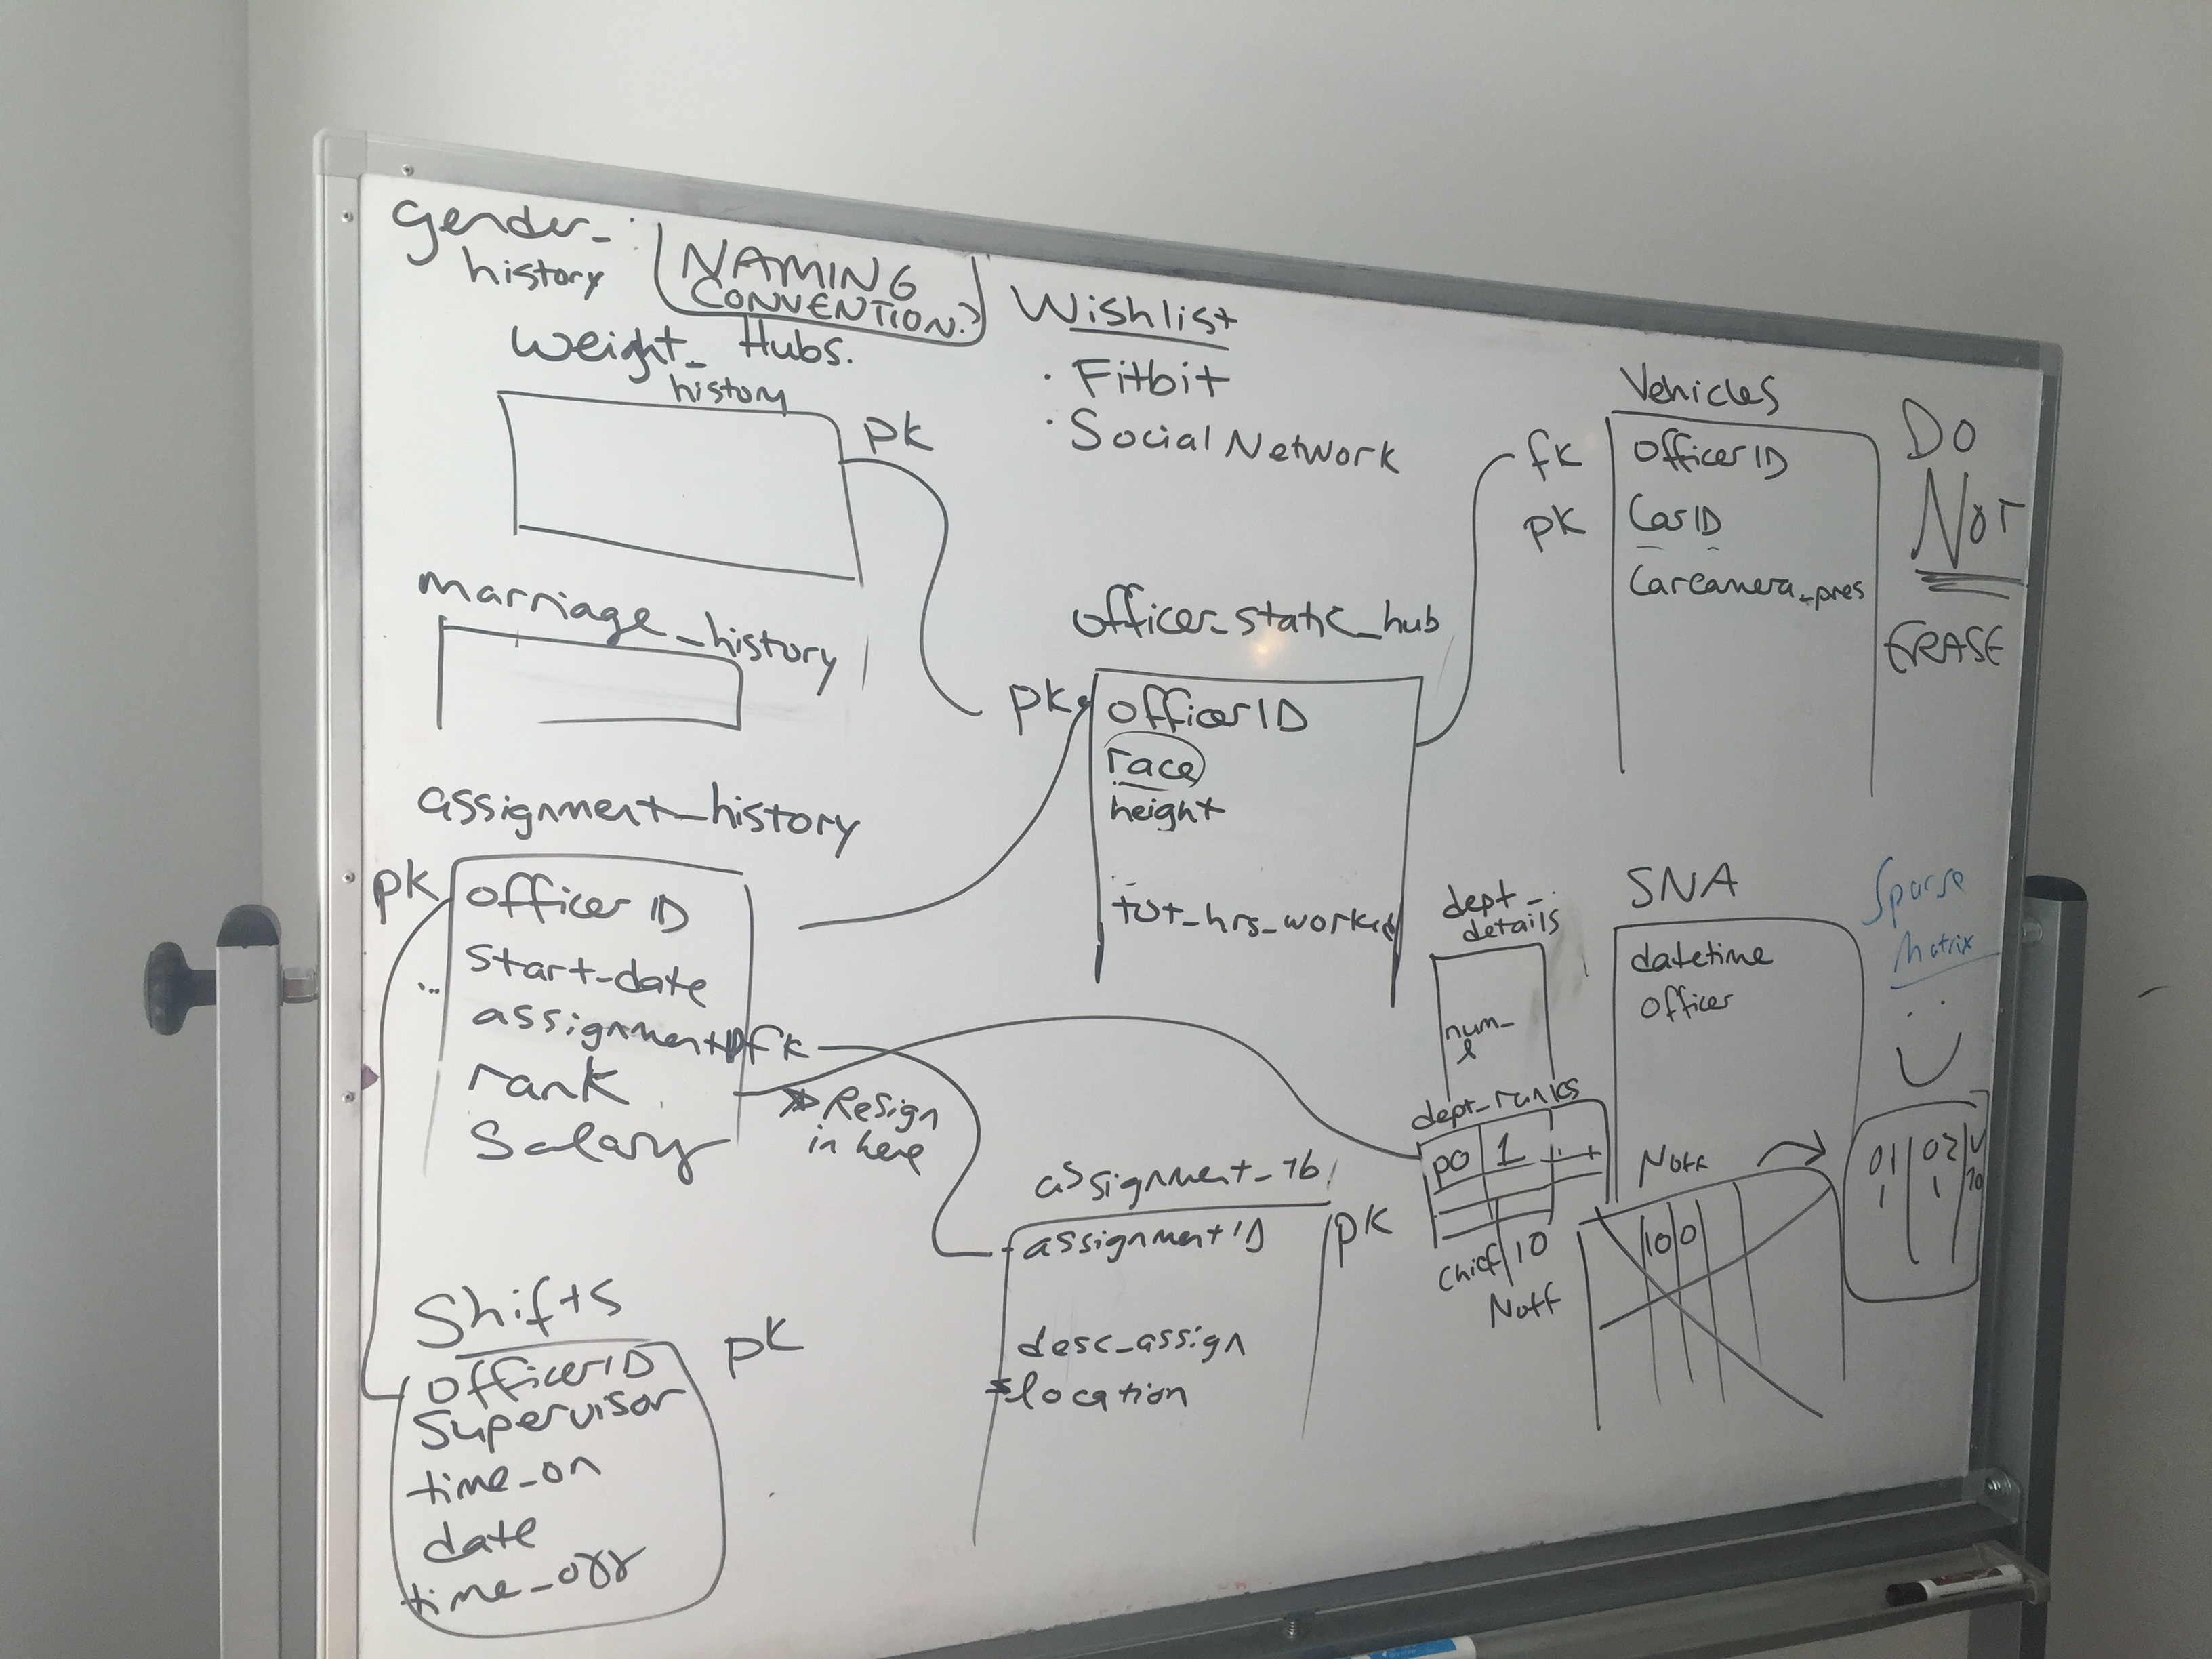
We had a wishlist for our ideal database. The architecture needed to be flexible enough that we could include new categories of data (things that we couldn’t yet foresee) without too much hassle. We wanted as little duplication of information as possible (in database parlance this process is called ‘normalization’), but not at the expense of usability. Additionally, it was important that we could update the information in the database while also retaining historical information — being able to look back at an officer’s behavior through time would be crucial to the kinds of models we want to build and run. There also needed to be logical joins between different categories, so that we’d always be able to see the connections within our data.
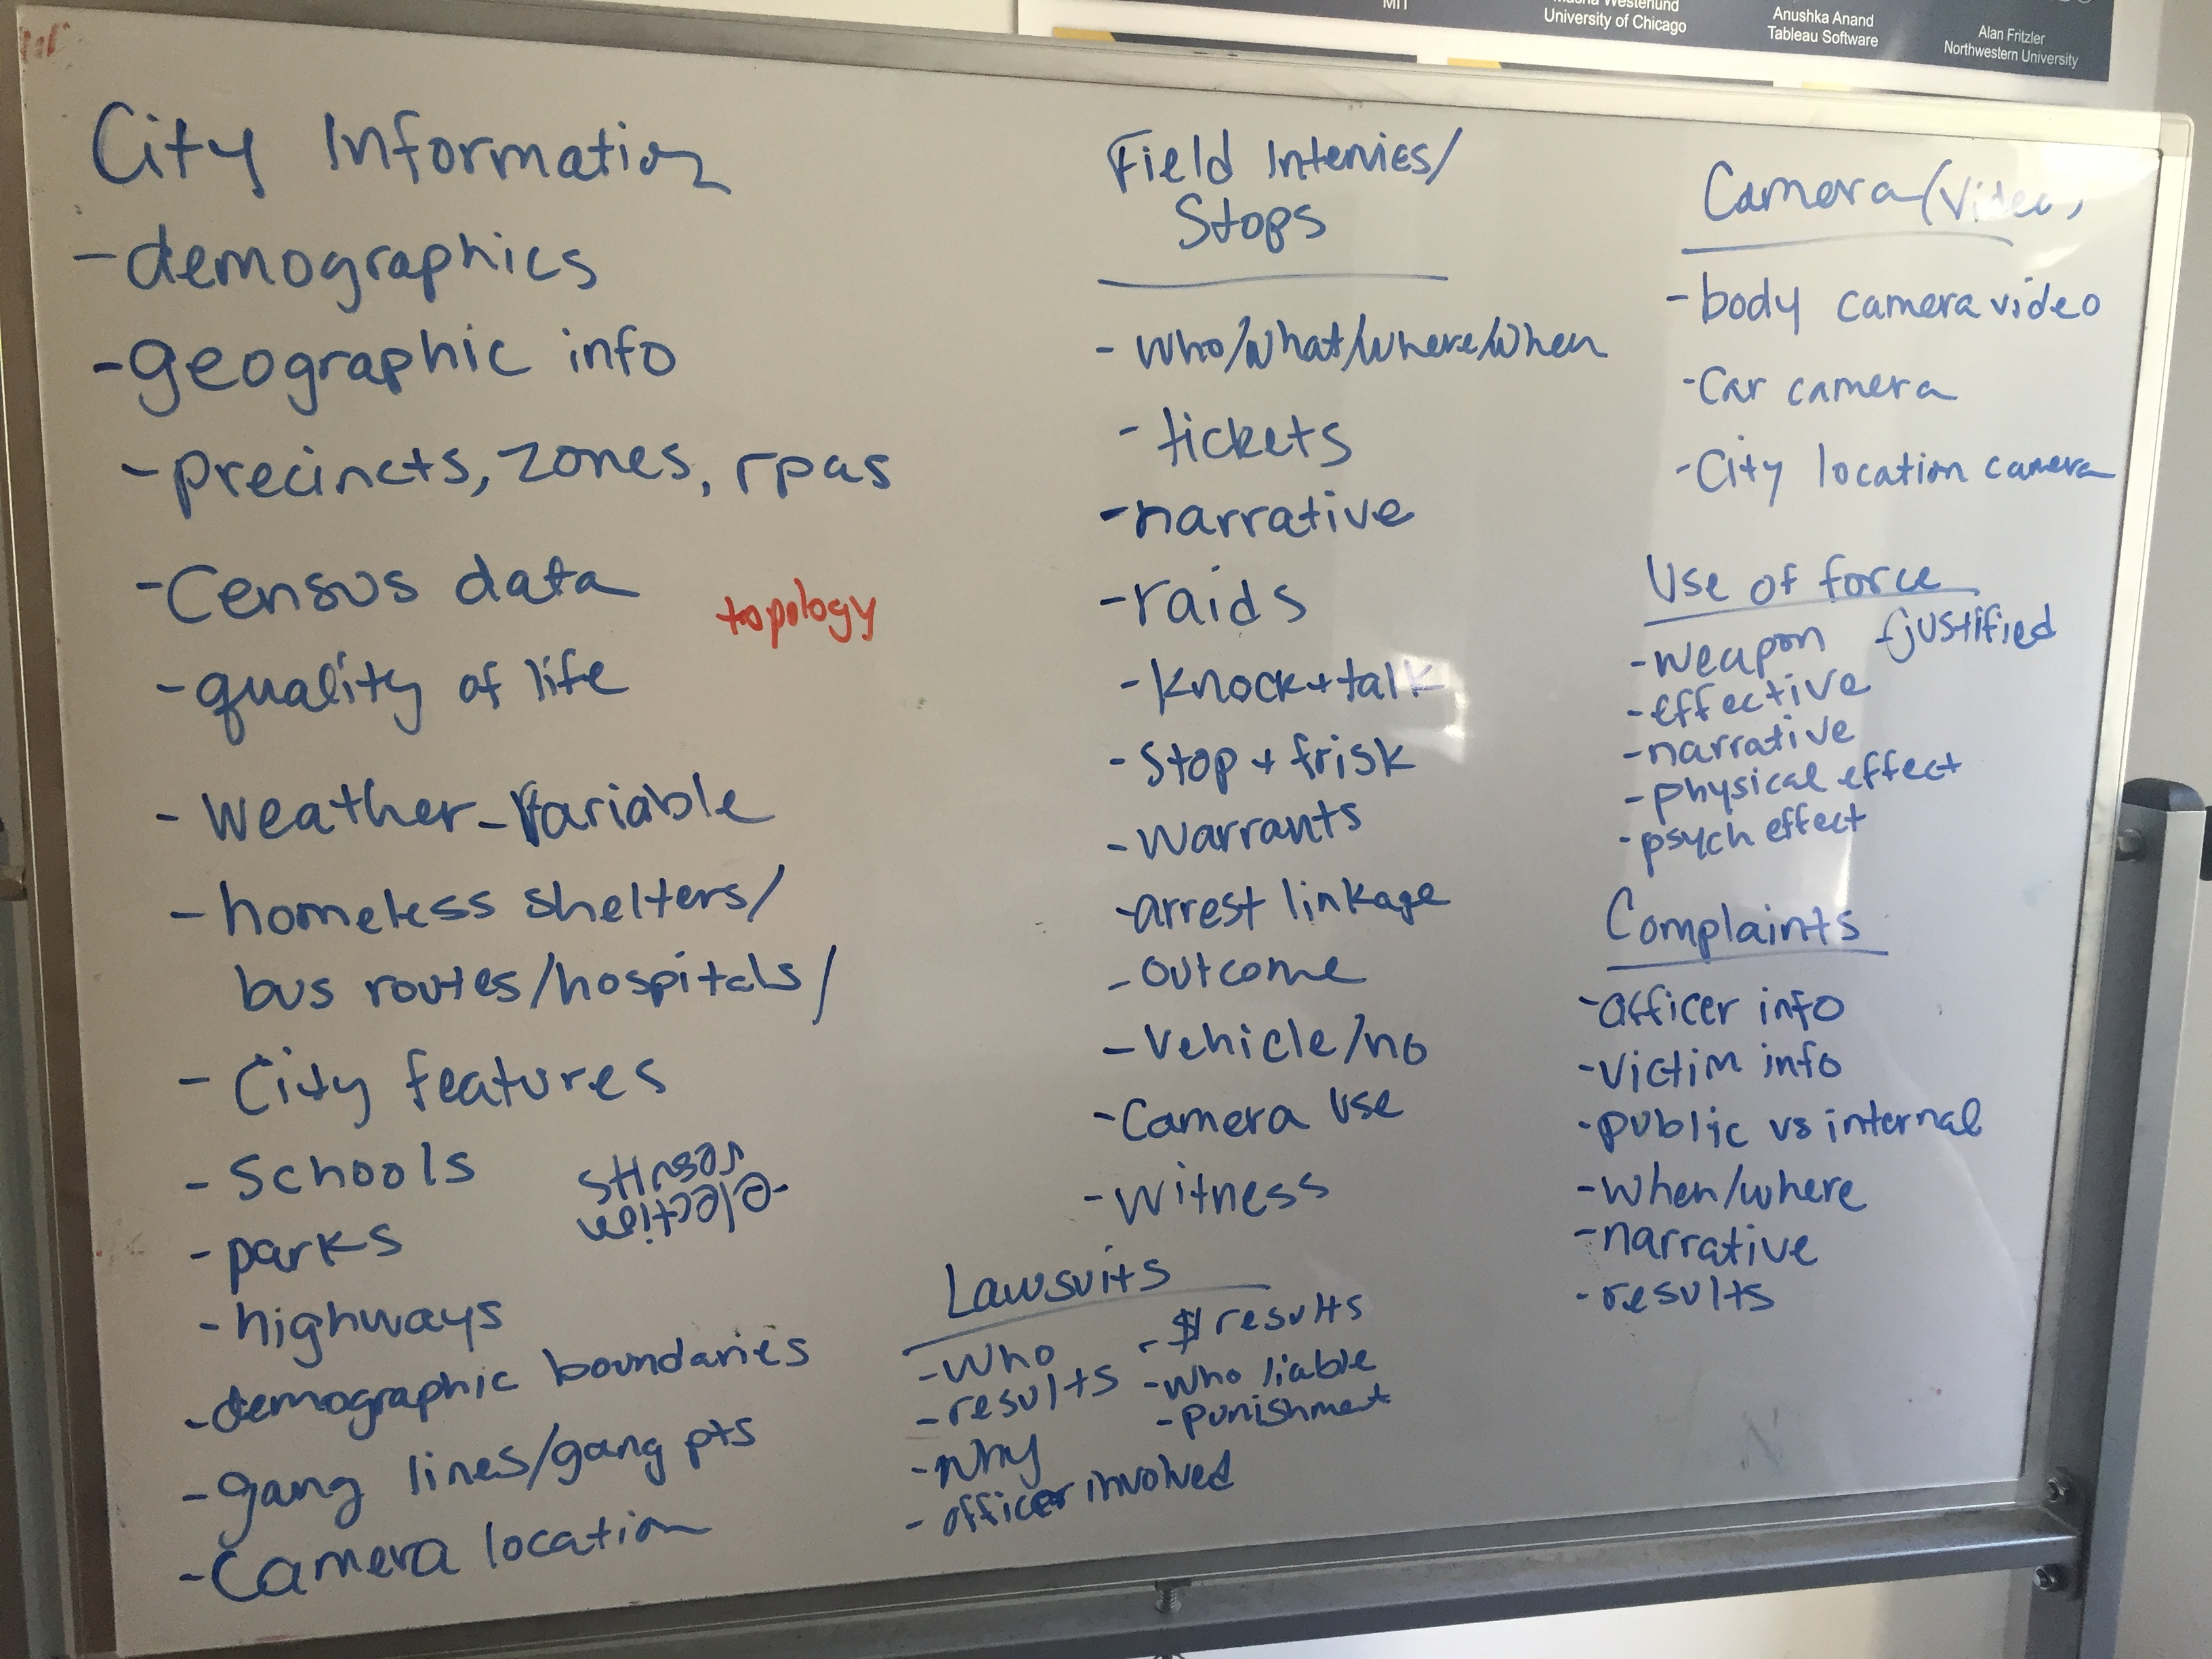
We literally went back to the drawing board, putting away our computers for the day, and commandeering all of the whiteboards in the DSSG space. We started off with sketching out the structure of what information our ideal database would contain. At this point, it wasn’t allowed to be referred to as a ‘database’, it was a collection of information organized into various themes like ‘officer personal information’ and ‘arrests’.
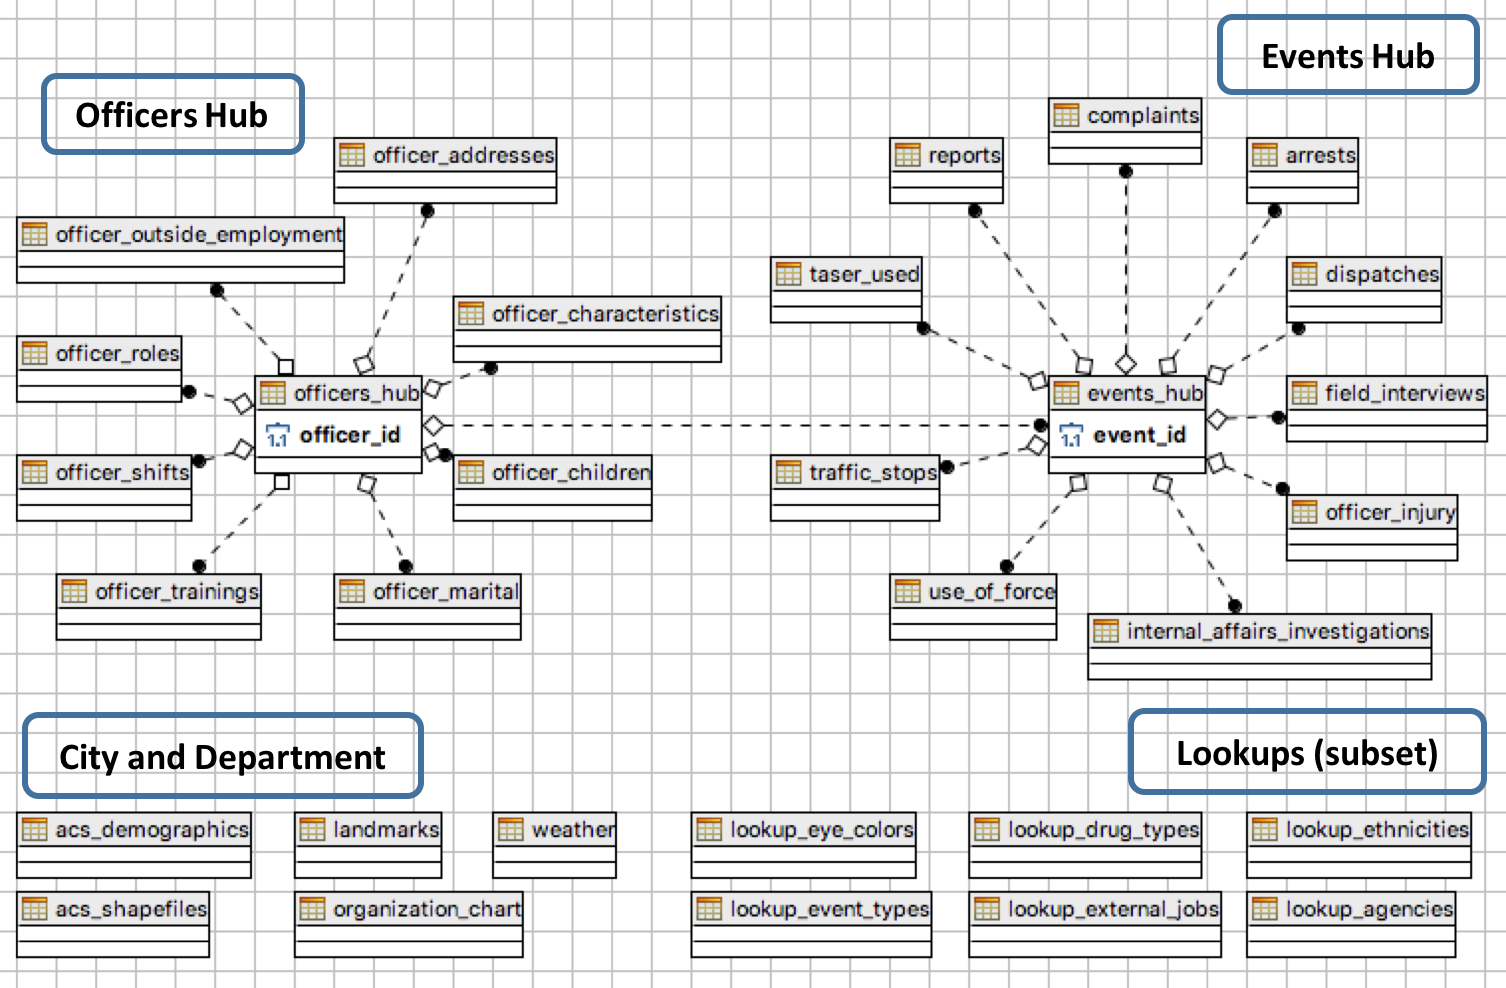
Once we had all of these themes catalogued and organized, we set upon designing the database architecture proper. After some debate, we settled on what we came to refer to as a ‘hub and spoke’ layout: four central ‘hub’ tables would be made for officers, shifts, events and city information. Each hub contains minimal information, but is sufficient to link all of the other peripheral information in the database (the ‘spokes’). For example, the officers hub table would link to a table of descriptive characteristics, as well as a table of training information, via an officer’s ID number.
It wasn’t always possible to arrange our data into a perfectly neat structure — the problem with trying to represent a complex, interconnected web of information as a matrix. When there was no good solution, we had to compromise. At this point, we received a word of caution from Rayid: don’t spend too much time debating the merits of a particular system, because it will very likely change later.
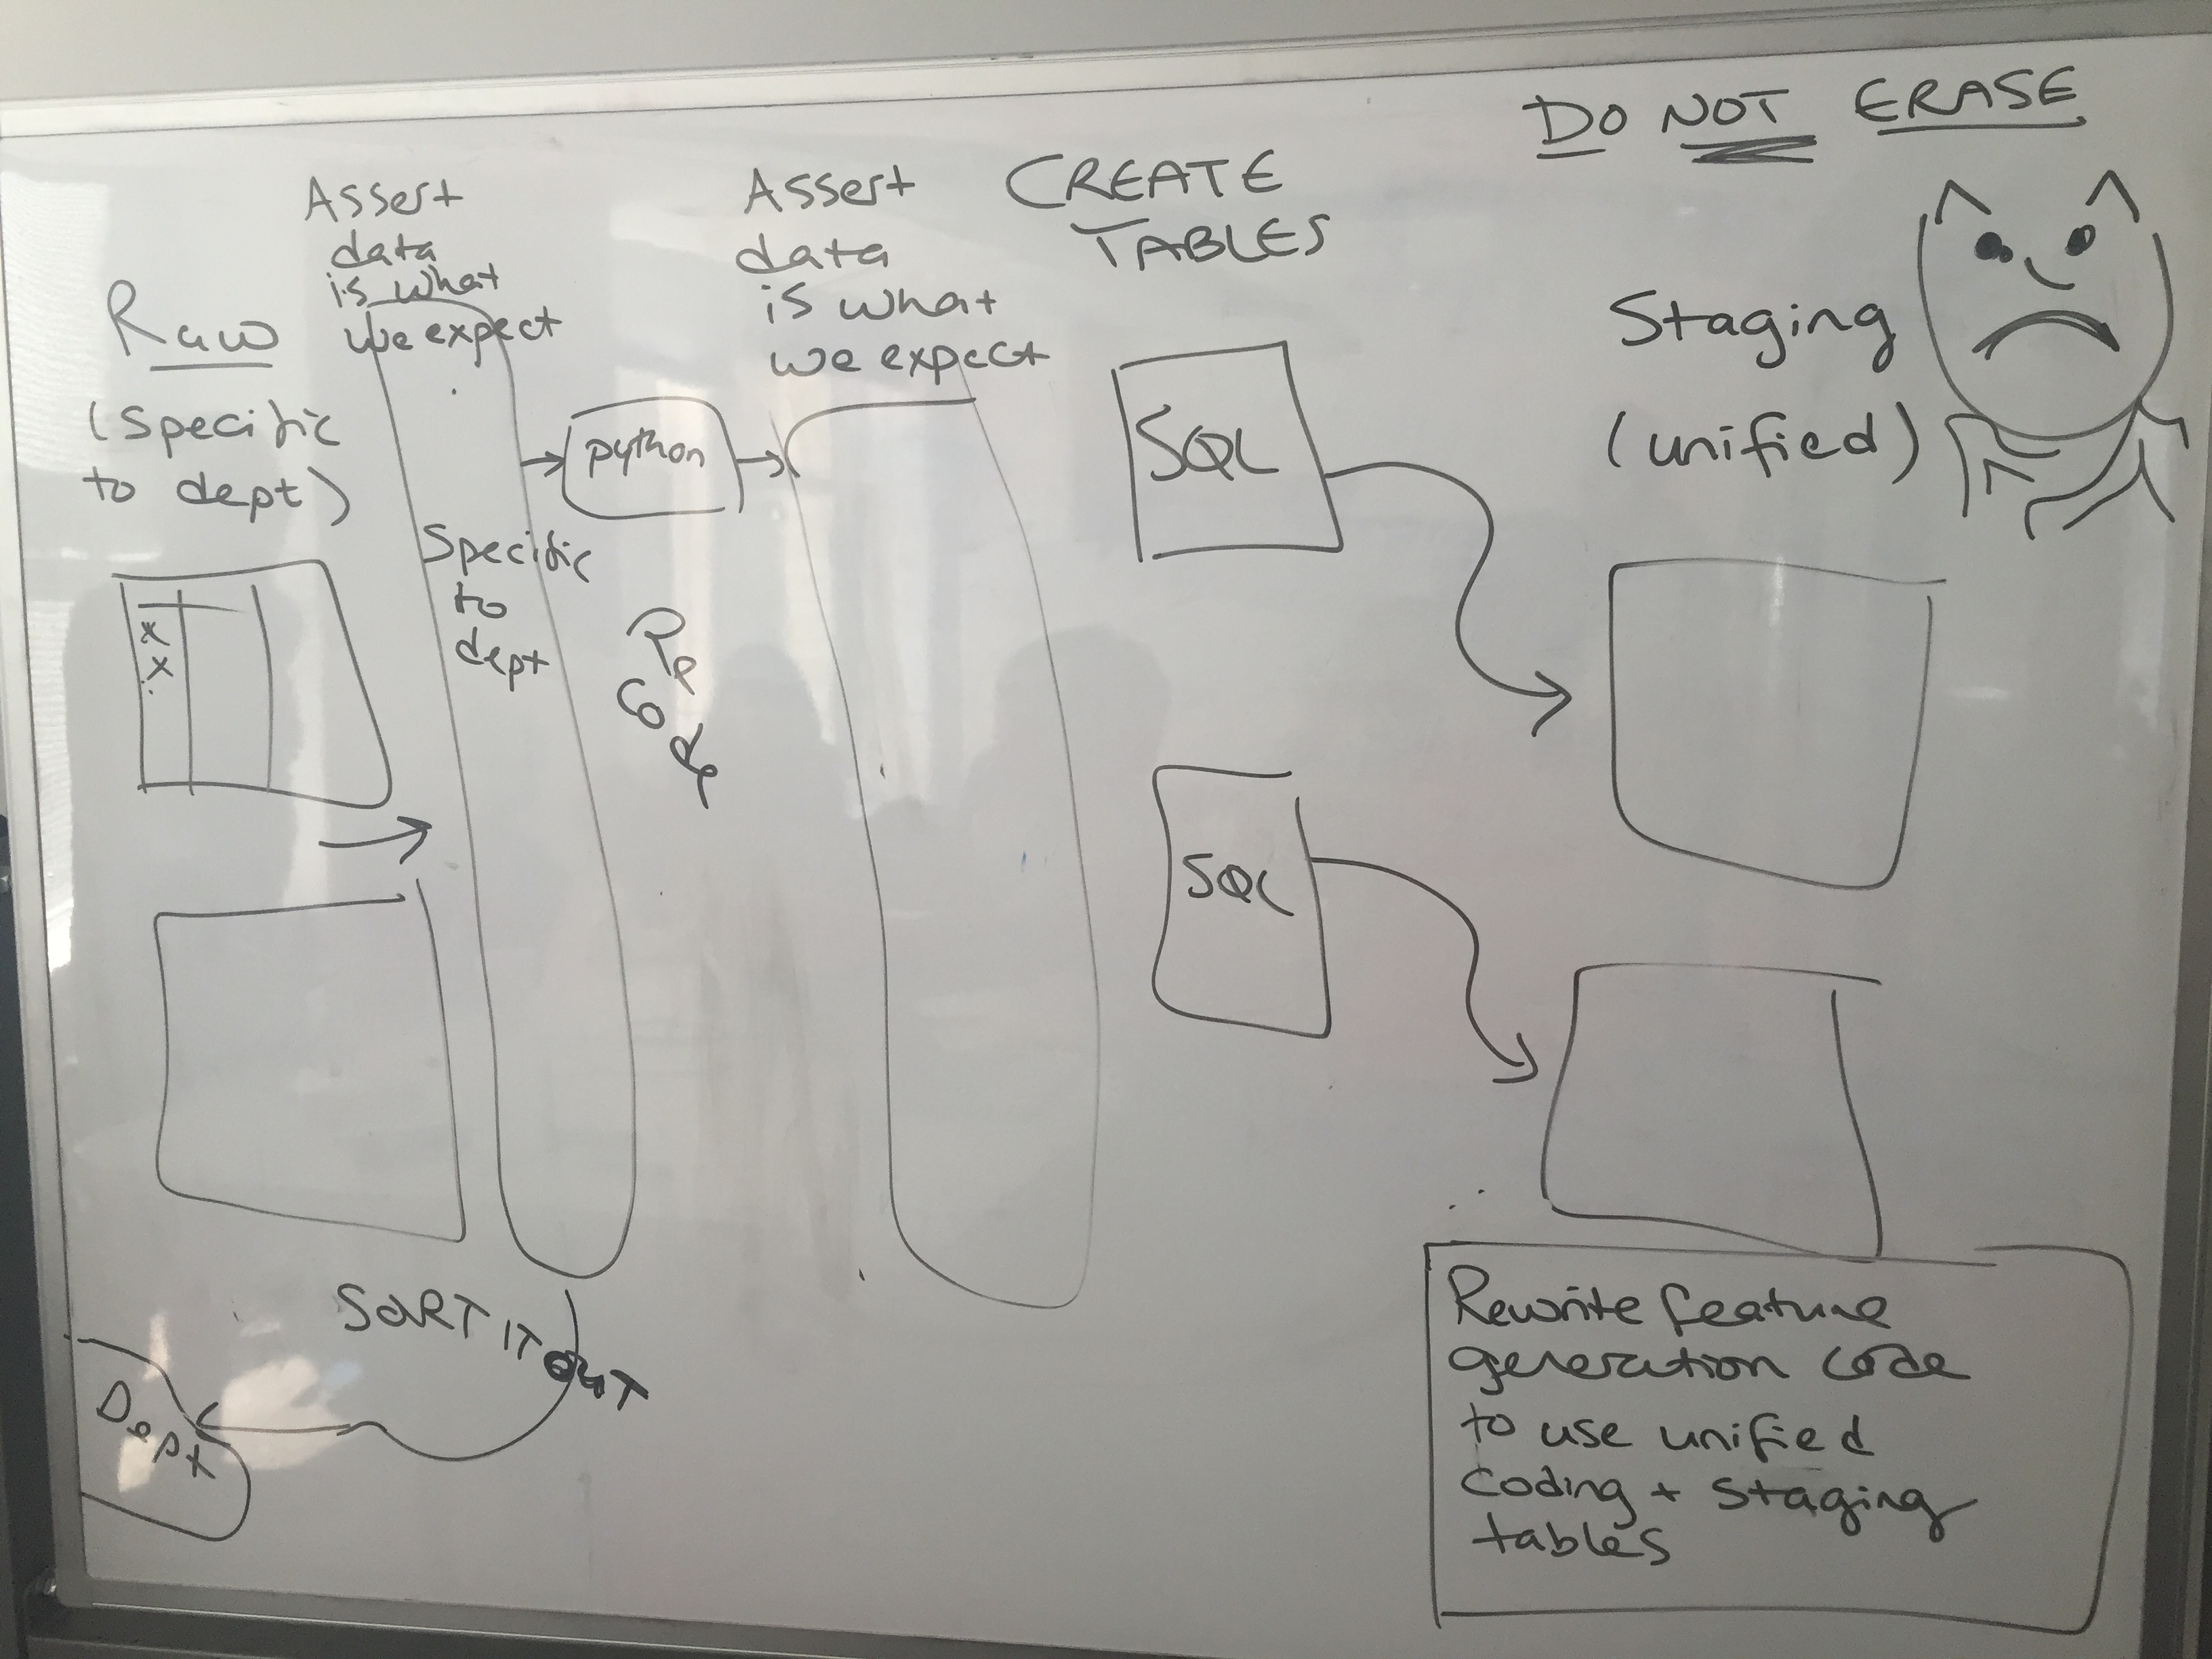
Rather than spend time debating the finer points of X versus Y, we should get started on getting the data in as quickly as possible. So when what we were doing became too myopic, we stopped, and cleaned up what we had. The next task will be to transform our existing data into the idealistic vision we have created. And how hard could that be?