
In our previous post, we described the challenge faced by our partners at Montgomery County Public Schools (MCPS). We analyzed a sample of about 11,000 MCPS students to determine if the MCPS early warning indicator system was reliably identifying students who may be off track and therefore at risk for not graduating on time.
To break down the problem and guide our work, we asked three more specific questions about early warning identification:
- Who? Which students are at risk of not graduating high school on time?
- When? When will a student go off track?
- Why? How can schools better identify particular student needs?
Who are the students at risk of not graduating high school on time?
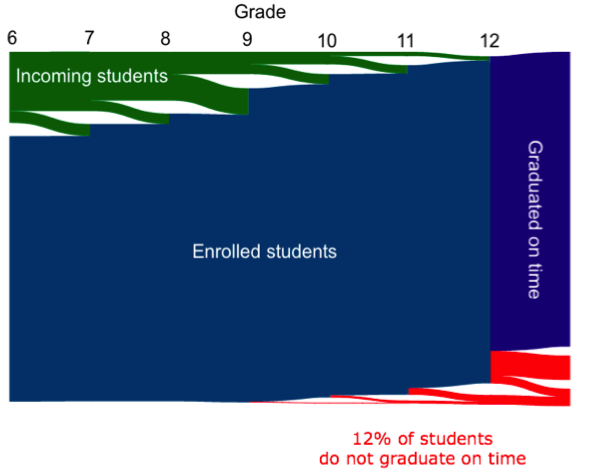
Our partners at MCPS provided us with middle and high school data (6th-12th grade) from students scheduled to graduate in 2013, a cohort of approximately 11,000 students. Students in this cohort enrolled in a Maryland public high school as a first-time 9th grade student in the 2009-2010 school year, and their last Maryland public high school of enrollment was MCPS.
The diagram below gives an overview of how many of the cohort students entered and exited the MCPS system year-by-year. Most students go through the system from 6th to 12th grade and graduate on time. There are also incoming students who enter a school in Montgomery County for the first time somewhere along that path. What we were most interested in were those students in red who either dropped out, or remained in the system past their fourth year because they did not pass enough courses and needed to repeat a grade – together, approximately 12 percent of students.
The goal is to identify these students as early as possible so that school staff can intervene and provide help proactively. MCPS tracks academic and behavioral data such as marking period mark average (MPA), test scores, absence rates, suspensions and other related information for each student. Additionally, they created a statistical model to combine this data and compute an “estimated support level” or “risk score,” where higher risk scores indicate a more pressing need for intervention.
We attempted to improve their model by using a number of techniques. For example:
- Including historical information: Many school districts that are using data-driven techniques to identify students in need of additional support, including MCPS, focus on data for a given quarter or school year. In the analysis we conducted, we included all data for a given student that would have been available up to that point in time. For example, to compute risk scores at the end of 10th grade, we used data for students from 6th-10th grade.
- Imputing data: For many students, specific data items were missing (e.g. the 7th grade, 3rd quarter MPA, or PSAT score). Instead of ignoring these items, we estimated them by computing the average of previous values for that student in the case of longitudinal measures such as MPA or taking the average across entire student cohort in the case of singular measures such as PSAT score.
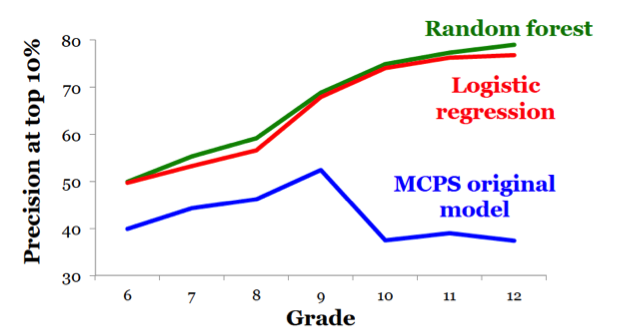
- Statistical and machine learning techniques: A common approach to identifying students in need of support is to compare certain data points to specific cut-points or thresholds. (e.g. Students with MPA 10% receive an additional point, etc. and points are totaled to compute the risk score.) These types of binary rules can miss out on important information and assume the different factors have equal importance. Certain analytical techniques (e.g. logistic regression, random forest) go beyond binary decisions and can identify the most important factors and weight them based on importance.
We evaluated the performance of MCPS’ original model (which has since been updated and improved) based on its accuracy among students identified as high risk. Specifically, we defined high-risk students as those who were in the top 10 percent of risk scores at the end of each year, and defined accuracy as the percentage of those high-risk students who eventually did not graduate on time. In the end, we were able to generate a different set of estimated support levels for the same students and improve accuracy from 40-50% to 50-80%! This new, more accurate model will be very useful to MCPS, helping them focus resources on students who truly need the most help. However, accuracy still needs to be assessed on the full student cohort.
When will a student go off-track?
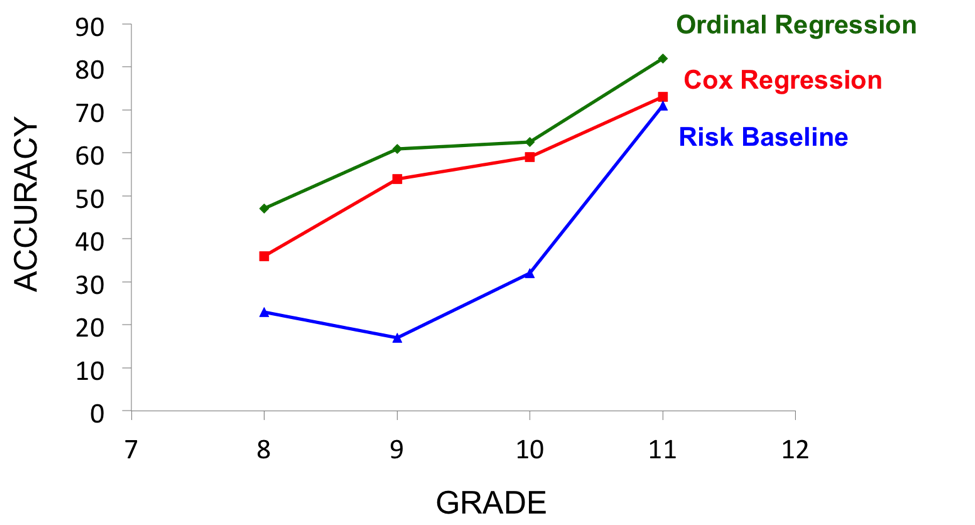
But just knowing that a student is at high risk of repeating a grade or dropping out sometime in the future is only so helpful. In addition to identifying at-risk students, it would help to know when a specific student is likely to go off-track, so that MCPS can prioritize important resources based on the urgency of student needs. One approach would be to use the risk scores generated by the classifier models described above, and predict time to off-track based on the magnitude of the score – in other words, students with higher risk scores would potentially go off track sooner. However, this may not necessarily be the best measure for urgency since those algorithms are optimized for predicting who will struggle, not when.
Another approach is to focus on the students who have been identified as high-risk, then using different models optimized for predicting when an event (in this case dropping out or repeating a grade) will take place. We compared two different models (ordinal regression trees [ORT] and Cox regression) to the predictions generated from risk scores. We found that the ORT model was the most accurate and could predict the off-track year with about 50-80% accuracy. Given our results, MCPS went back and analyzed their data for all students in the file using logistic regression analysis.
Why is a given student struggling?
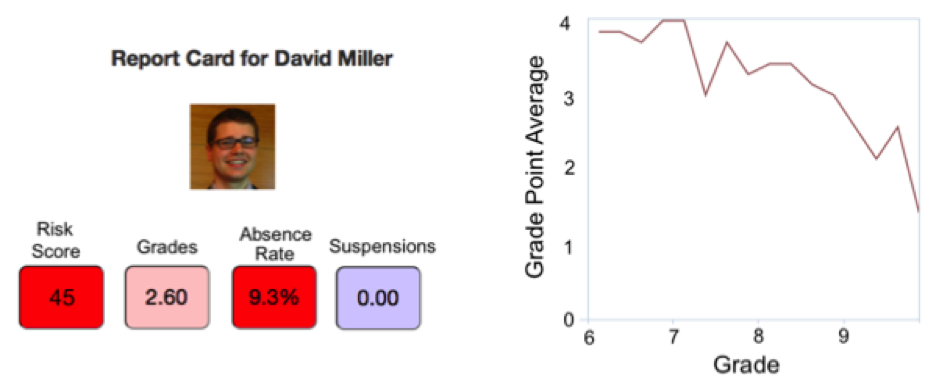
Not all students at risk for going off-track struggle for the same reason, and effective interventions should be crafted to address an individual student’s troubles. So figuring out why a student is at high risk of repeating a grade or dropping out is also important. While we cannot answer this question directly from the data, we built a prototype web-based dashboard that can present student data in a concise, digestible manner, to help teachers and counselors hone in on specific needs.
For example, certain students may have low MPAs but always attend school while others may have high absence rates but average grades. Additionally, by displaying the trajectory of certain characteristics over time, it is easy to notice upward and downward trends. This type of tool can help school staff more easily identify the needs of a given student and consequently provide the appropriate intervention.
Future Work
The next important step is to try and match struggling students to interventions. We hope to run experiments of evidence-based programs and develop models of students’ responsiveness to particular interventions. Moving forward, several of the 2014 fellows will continue working on these problems as researchers in the Center for Data Science and Public Policy (DSaPP).
Those DSSG alumni are working with additional school districts to conduct analyses similar to our work with MCPS. Now that many of the data cleaning and modeling processes have been created, it will be much easier and faster to repeat the analysis with new districts once their data is in hand.
DSaPP data scientists will also expand upon the work from the summer to:
- Understand the different factors that lead to high risk and high urgency
- Investigate how these factors are related to post-secondary outcomes, and use those relationships to help identify “undermatched” students who are likely to succeed in college, but unlikely to attend
- Compare modeling results across different student cohorts who graduated at different times
With invaluable assistance from our partners at MCPS in providing both data and guidance throughout the summer, we have created a “data science pipeline” that can take in student data and produce risk scores. Since many school districts are already tracking student data similar to MCPS, there should be no shortage of potential partners. As DSaPP continues to form partnerships with school districts around the country and world, there will be many interesting insights and comparisons to be made.