Street lights are one of many public services that residents take for granted. In addition to helping us avoid car crashes, alley and street lights allow us to be aware of our surroundings and can help prevent devastating crimes like theft and assault.
But while residents don’t typically notice street lights until they stop working, city officials struggle daily with the task of keeping the network of more than 250,000 lights as operational as possible. What level of resources should Chicago devote to repairing outages quickly amidst the city’s budget difficulties? Which outages should be given priority to be fixed?
To make these decisions, the smart use of data is essential. The City of Chicago has to understand and quantify the impact of its services on residents. Without a sound statistical approach that properly accounts for the variety of factors affecting outages and crime, the City will come to the wrong conclusions.

The Chicago Department of Transportation (CDOT) asked our team of Jonathan Auerbach (Statistics, Columbia), Matt Gee (Public Policy, University of Chicago), Alessandro Panella (Computer Science, University of Illinois at Chicago) and Zach Seeskin (Statistics, Northwestern) to use City of Chicago data to investigate the relationship between street light outages and crime. We set out to answer the following questions: If an alley or street light outage occurs, does crime increase in the area? If so, by how much? Is the increase uniform across the entire city of Chicago, or is the increase only in certain areas?
Getting to Know the Data
In order to tackle these questions and find a strong modeling strategy, we explored the data to investigate the factors affecting street light outages and crime. We learned some interesting facts about outages in Chicago.
Using open data from the City of Chicago Data Portal, we examined the duration of outages in Chicago over the period from April 2012 to July 2013. Below are histograms showing the durations of three different types of outages: alley lights out, one street light out, and street lights (all out), which refers to an outage of three or more street lights.
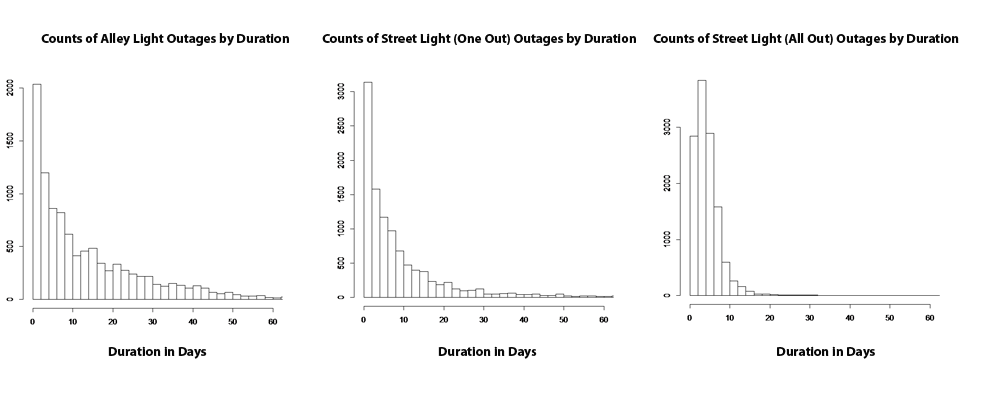
As seen in the plots, most outages are repaired quickly, while a small number of outages last much longer. Also, street light (all out) outages are repaired more rapidly than the other two outage types. Street light (all out) outages have a mean duration of about 5 days, whereas street light (one out) outages last 11 days on average, and alley light outages last an average of 15 days.
To demonstrate patterns in outages and crime over time, the two charts below plot the number of outages and crimes by month between April 2012 and July 2013, both based upon data from the City of Chicago Data Portal.
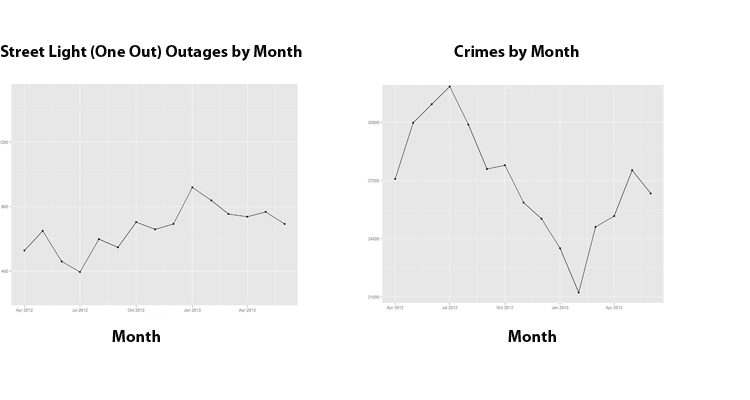
Of particular interest is the strong seasonal pattern in crime. Crimes peaked in July 2012 before reaching a low in February 2013 and then reaching a smaller peak in June 2013. This reflects the well-known fact that warmer weather can increase crime rates. The strong variation in crime rates over time is therefore important to consider in modeling the relationship between outages and crime.
Below are two maps showing the number of street light (one out) outages and the number of crimes by community area. Darker shades of red and green indicate more outages and crime respectively. We see in this map that neighborhoods that have more outages also tend to have more crime.
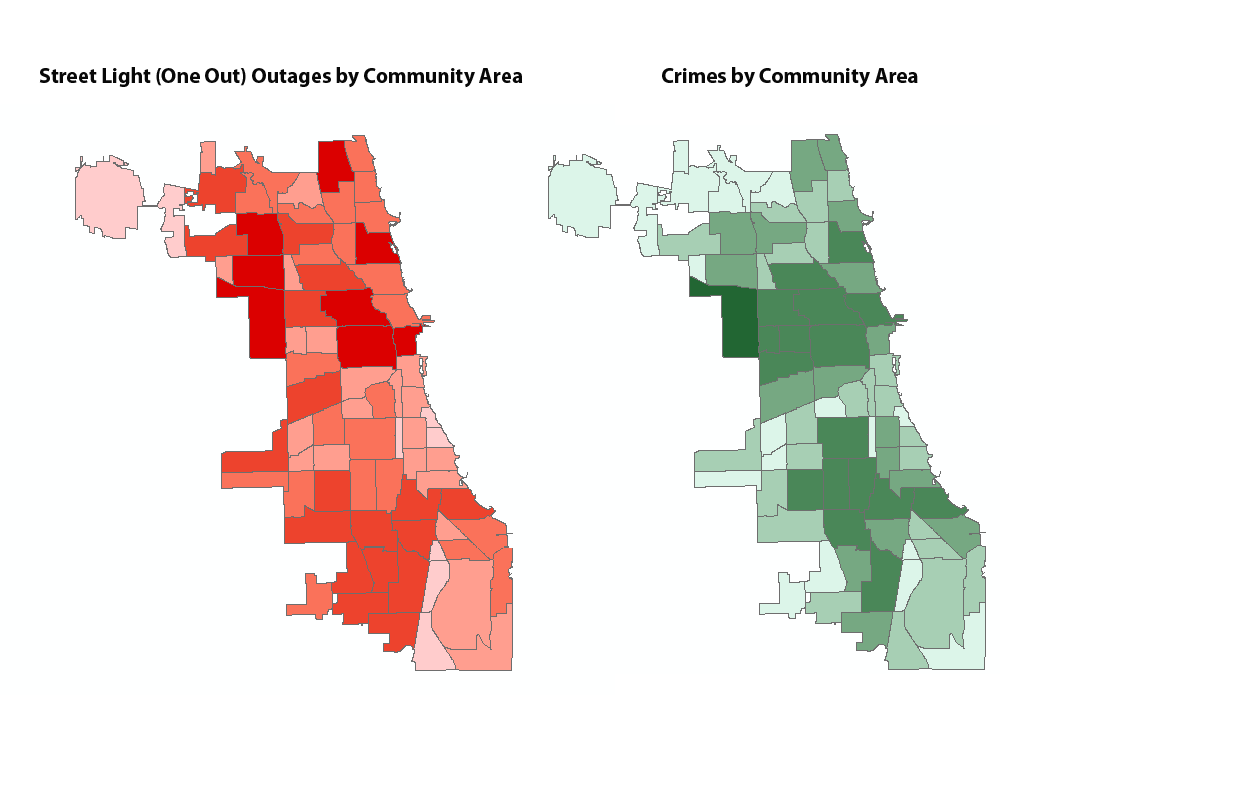
At first, these maps present a case for a strong relationship between streetlight outages and crime. However, merely comparing crime rates between areas with outages and areas without outages could be highly misleading. There may be factors absent from our data that cause certain areas of the city to have both high crime rates and be susceptible to outages. Therefore, relying purely on correlations would lead to a poor analysis.
Further, we learned that crime rates can impact how long it takes the city to repair a street light. The below chart plots the average crime rate for a street light (one out) outage-affected area by duration of the outage. The crime rate is an average from the times immediately before and after the outage. In the background is a red histogram of the number of outages by duration.
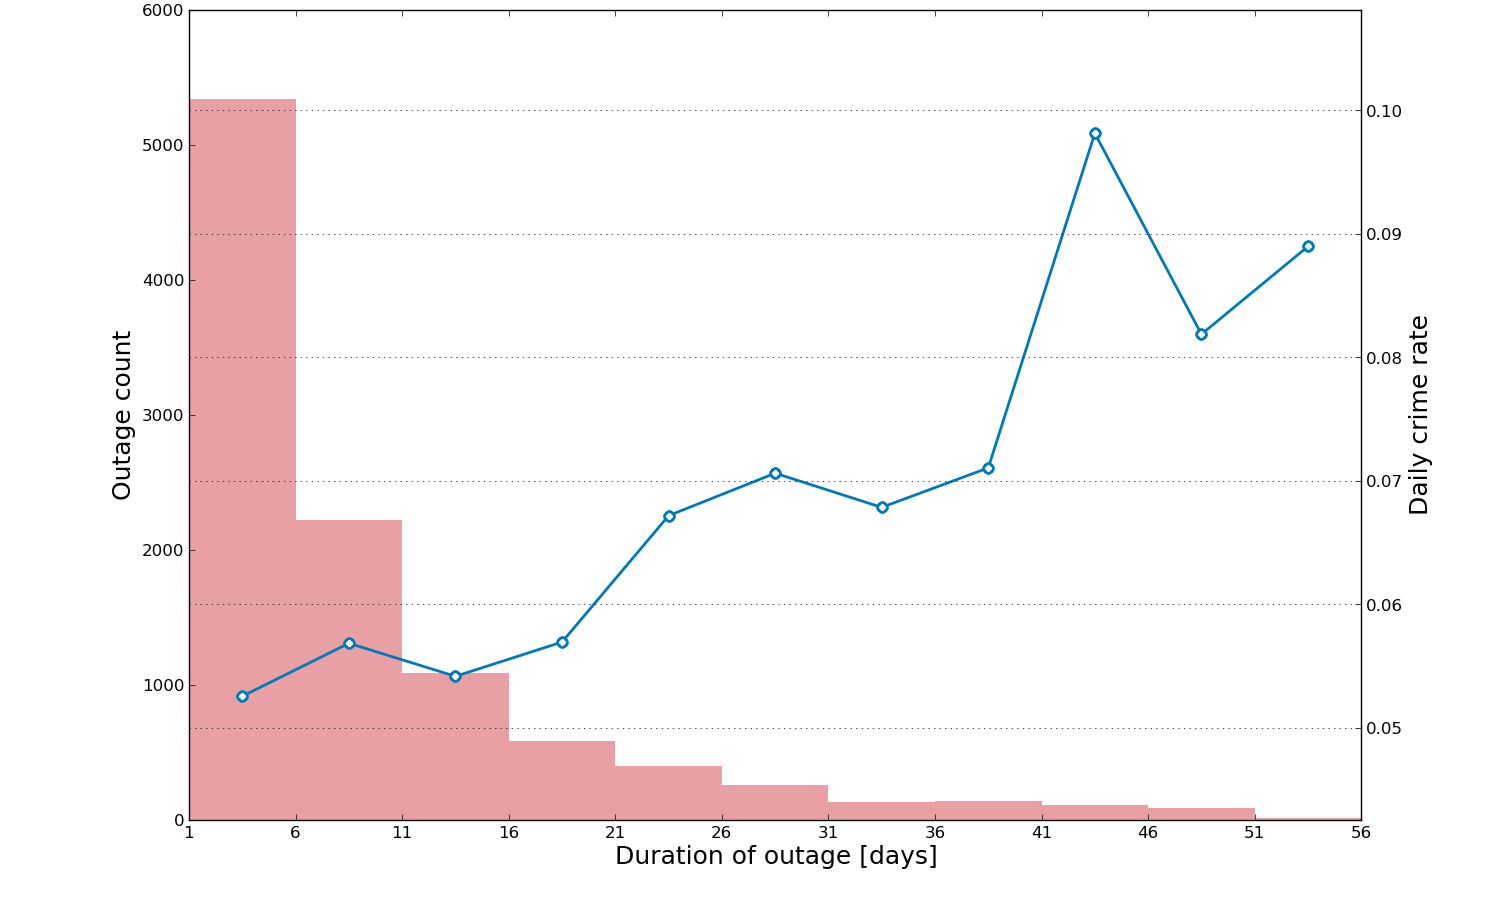
Clearly, it takes longer to repair outages in high crime areas. This makes sense, as the city needs to take greater care when making repairs in high crime areas.
However, this phenomenon shows that a correlational approach would yield very poor estimates. A correlational analysis would generally place more weight on longer outages as each outage day is an additional data point. But because longer outages tend to occur in high crime areas, this approach would greatly overstate the association between outages and crime.
Our initial exploratory work shows that comparing crime rates across different areas would be a naive way to conduct the analysis. Instead, we found a smarter approach.
Comparisons Within Outage-Affected Areas
We studied the relationship between outages and crime by comparing the crime rate in the outage-affected block during the outage to the average crime rate in the same block for time periods immediately before and after each outage. The advantage of this approach is that each outage-affected area serves as its own control. As we have discussed, comparisons between different areas of the city can get messy as different areas experience different trends and different crime levels. We solved this issue by comparing each outage-affected area to itself.
However, to compare different time periods, we needed an approach that accounts for trends in crime over time — the seasonal fluctuations we demonstrated earlier. We used Poisson Generalized Linear Models (Poisson GLMs), which have good properties for studying rates as an outcome variable. The modeling allows for including monthly indicator variables that capture the overall Chicago crime trend as well as outage area fixed effects that allow for within area comparisons.
For each of the three outage types, we examined associations with nine different types of crime that could plausibly be affected by outages (and only incidents that occurred outdoors). In order of prevalence, these are narcotics, theft, battery, criminal damage, motor vehicle theft, robbery, assault, burglary, and homicide.
We found that street light (all out) outages are associated with an increase in crime of 7.4% in the block of the outage (p value 0.032). In particular, we found an increase in battery of 18.6% (p value 0.018). At the block level, we did not find a relationship between crime in aggregate and either alley light outages or street light (one out) outages.
We next needed to determine whether the relationship between street light (all out) outages and crime was uniform throughout the city or particularly prominent in certain areas. So, we ran the same Poisson GLMs described earlier within each of the 77 community areas of Chicago. The results are displayed in the map below.
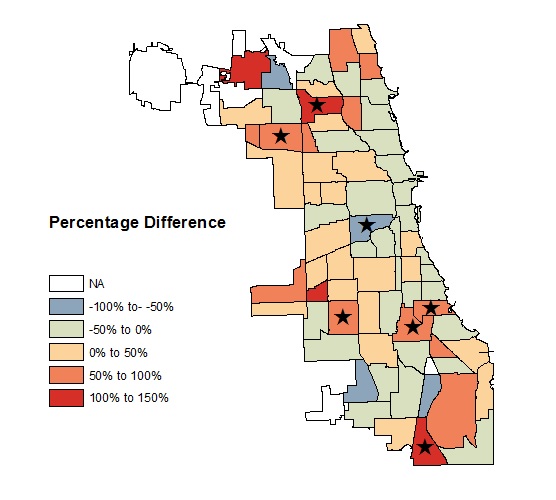
For some of the community areas, there were not enough crimes in outage-affected areas to estimate the model, and these are white in the map. In the seven community areas with stars, we found a statistically significant change in crime rates during street light (all out) outages (six increases and one decrease): 81% in Belmont Cragin, 67% in Chicago Lawn, 60% in Greater Grand Crossing, 134% in Irving Park, -55% in Lower West Side, 126% in Riverdale, and 58% in Woodlawn.
Transforming Information Into Action
Using City of Chicago data, we have provided CDOT with valuable information that will be used to better serve the city’s residents and to make Chicago safer. CDOT can now organize its workflow for repairing alley and street light outages with a more concrete understanding of the relationship between outages and crime. Prioritization can be given to areas of the city where we find a positive association between street light (all out) outages and crime. Further study is needed to prove whether there is truly a causal relationship between outages and crime in the areas where we found an association, and CDOT can focus its investigation on these areas to better understand why outages in these areas are associated with crime.
The decisions that city departments make and the actions their workers take can impact the everyday lives of residents. Now, data has made it possible to measure the impact of those efforts and adjust them accordingly in order to best serve the community. In the long run, we believe that the use of this data along with thoughtful analysis will provide the basis for a smarter municipal government that serves its citizens better.
To learn more about our project, visit our GitHub page.