
“Education is the most powerful weapon which you can use to change the world.” – Nelson Mandela
In today’s world where innovation and creativity are the key drivers of any economy, the importance of educating young minds is unquestionable. Governments invest massive resources to ensure that primary and secondary education is within reach for all of their citizens. Yet in spite of these efforts, more than a million kids leave school each year without earning a high school diploma, and the dropout rate remains at 7 percent in the United States. Across the country, schools are looking for new ways to identify struggling students so that new, more targeted interventions may help them resume their educational progress before it’s too late.
This summer, our team — fellows Everaldo Aguiar, Nasir Bhanpuri, Himabindu Lakkaraju, David Miller, and mentor Ben Yuhas — is working with Montgomery County Public Schools (MCPS) in Rockville, MD, to validate an early warning indicator system MCPS developed to identify students at risk of not graduating high school on time. In addition, we will attempt to measure how well various factors — such as grades, attendance, and changing schools — serve as early warning indicators.
Located directly north of Washington D.C., MCPS has 38 middle and 25 high schools. Our partners at the county provided de-identified data on a cohort of 11,000 students whose academic outcomes were monitored from the beginning of middle school to the end of high school. The dataset includes rich — but anonymous — information about students’ trajectories including students’ marking period averages, test scores, number of suspensions, absence rates, mobility, retention and whether the students were new to MCPS.
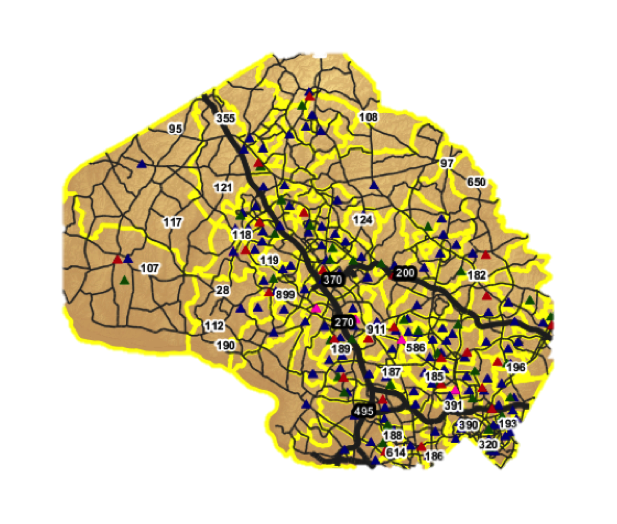
A map of the Montgomery County Public Schools district, via the MCPS website
MCPS already uses many methods to identify students who may be at risk of not graduating on time in order to match them with evidence-based interventions. With its early warning indicators system, MCPS uses advanced analytic techniques to build new tools for monitoring students. Our work is to assist them in exploring these data through various models to achieve a more complete understanding of the factors that contribute to students not graduating on time. Over time, such an approach can lead to a more efficient allocation of resources and larger improvements on graduation rates.
Measuring Success in School
“I don’t measure a man’s success by how high he climbs but how high he bounces when he hits bottom.” – George S. Patton
Before analyzing the data, we first took a step back and brainstormed with our partners at MCPS about how to best characterize academic success. We came up with three different metrics for measuring students’ success :
- Graduating “on-time” from high school (i.e. 4 years after starting)
-
Graduating from high school (not necessarily on time) without dropping out
-
Graduating high school without ever being “retained” (repeating a grade)
After several discussions on what constitutes the right notion of a successful student, we agreed to use “on-time” graduation from high school (Point 1 above). Students who drop out of high school are shut out from many advanced education and employment opportunities, and students who graduate late create large economic strains for educational systems. The metric of on-time high school graduation captures both of these student types.
This metric is also attractive because it does not penalize a student who did poorly at some point in school, but managed to bounce back and graduate on time. However, we also decided to explore other academic outcomes not directly related to graduation, such as whether students’ grades and attendance rates improve over time. Together, these questions will help us devise solutions that assist MCPS in identifying struggling students at early stages and suggesting appropriate interventions.
Learning From Data
“We’re entering a new world in which data may be more important than software.” – Tim O’Reilly
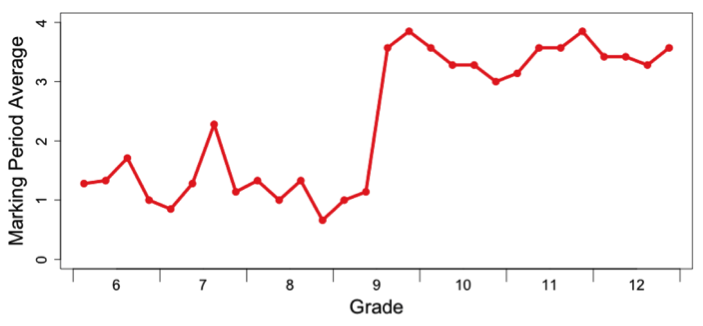
Our preliminary analyses illustrated the diverse trajectories that students take to reach academic success or failure. For instance, the student in the below graph struggled in middle school by earning D’s and C’s, but dramatically reversed that pattern in the middle of ninth grade.
Students like the one above helped remind us that student success is a process, even if our key dependent variable (graduating high school on-time) may be a single outcome. Conversely, students’ struggles are multifaceted. For instance, both of the students shown below could be considered at risk out of not graduating on time once in high school. However, their individual stories differ.
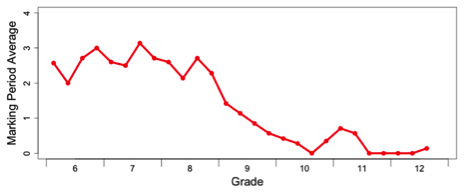
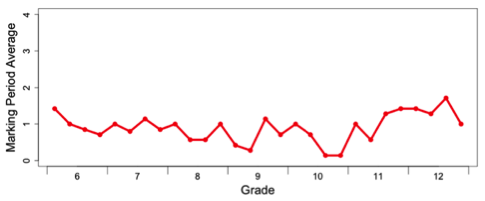
The top student earned decent grades in middle school, but the student’s grades plummeted in the transition from middle to high school and never recovered. On the other hand, the student on the bottom consistently did not perform well. Teachers and administrators likely would need to tailor different interventions to match these two students’ particular needs.
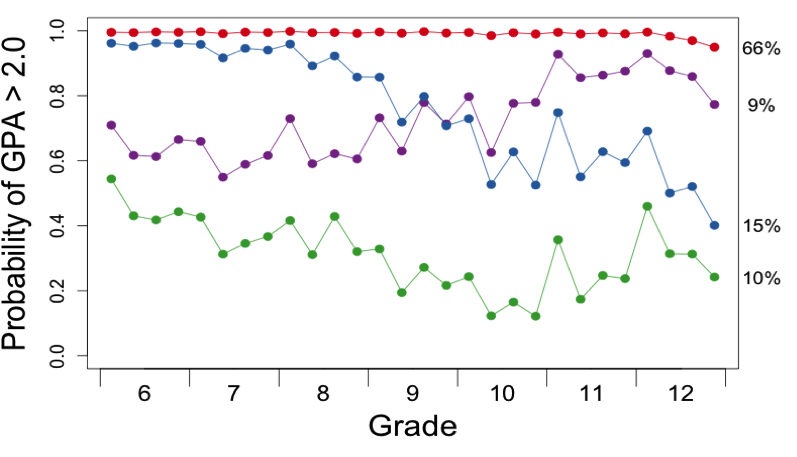
We found that the longitudinal trajectories exhibited by most students could be grouped into four categories as shown in the figure below. For instance, we found that 15% of students (the blue line) started to consistently earn grades below C’s in high school even when they performed well in middle school. Further, about 9% of students (purple line) demonstrated an improvement in their grades in high school. The good news is that a majority, 66% of the students (red line), consistently secured a GPA higher than 2.0.
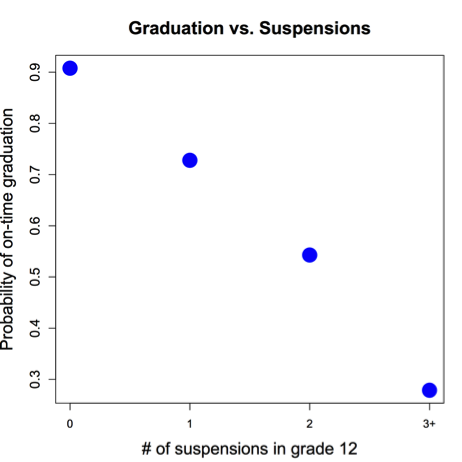
After we explored patterns like these for grades and other independent variables, we started to look at how they related to the key outcome of on-time high school graduation. For instance, we found that an increase in the number of suspensions correlated with a substantial decrease in the probability of a student graduating on-time.
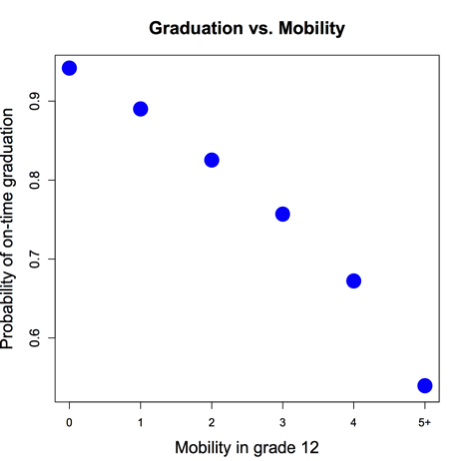
Similarly, an increase in the cumulative number of times a student changes schools within the same school year (mobility) related to a linear decline in the probability of a student graduating on-time. These preliminary analyses helped confirm and support the factors MCPS identified in their early warning indicator system.
Our Solutions
“We become what we behold. We shape our tools and then our tools shape us.” – Marshall McLuhan
After our preliminary analysis, we formulated four complementary problems, each of which constitute a piece of the puzzle for identifying struggling students.
First, we treated the problem of determining students at risk for not graduating on time as a classification problem. The goal here is to place students into two categories – at-risk and no-risk, by leveraging all the stationary (gender, age) and time-dependent (GPA, absence rates, suspensions) input variables. In order to solve this problem, we plan to use standard classification approaches such as logistic regression, decision trees and ensemble techniques such as random forests.
In addition, we would like to determine if a student is at risk as early as possible instead of waiting until the end of high school, when it will be too late to intervene. The earlier we make this prediction, the higher the chance of providing an appropriate and successful intervention. We therefore tried to predict on-time graduation of students with reasonable accuracy using only a subset of data; for example, data only through middle school.
Second, another interesting problem to look at in our setting involves estimating the point in time when a student is likely to drop out or have to repeat a grade. These kinds of predictions are extremely useful in determining when an intervention should be offered to a student in need. In order to address this problem, we employ techniques from survival analysis literature, such as the Cox proportional hazards model.
Third, we would like to determine the most important warning signs to watch for with individual students. For instance, a student may have strong grades, but the student’s attendance and tardiness may indicate an elevated risk of not graduating on time. During the discussions with our partner, we realized that obtaining these kinds of fine-grained insights about individual students is extremely valuable to them.
Though this is a particularly hard problem to solve precisely, we attempt to leverage proxies for tackling it. We plan to use weights from models such as logistic regression to help us in determining which factors are contributing the most to a specific student’s outcome. In addition, we plan to take cues from the Cox proportional hazards model in determining the impact of various factors on the timely graduation of students.
Finally, we plan to explore clustering techniques for grouping students by their type of academic trajectory, akin to the decreasing or increasing grade patterns described above. Such techniques include standard approaches such as k-means and latent class analyses and also more complex models such as growth mixture models.
These clustering approaches could help teachers and administrators target interventions towards particular groups of at-risk students. For instance, the clustering approaches may group together all the students with particularly low grades in math exams as a group that needs attention and assistance. This information could then help schools in designing a specific intervention for this sub-group of struggling students.
As can be seen from all the points discussed above, the emphasis of our study stretches far beyond merely predicting if a student is at risk of graduating on time or not. We want to know when students are likely to drop out, what specific factors predict academic struggles, and find specific sub-groups of at-risk students that can benefit from focused interventions. Through this combination of goals, we feel we can best help MCPS (and other schools) with their primary mission of high quality education for all of their constituents.