
Are you hearing a lot of data-themed buzzwords lately? Are you wondering whether the use of data science can help a project on which you are working?
Using data makes it easy to prove the efficacy of a project and inform your decisions. More simply, data science is the process of taking all the data you have lying around and turning it into actions.
Who are we? We’re a team of three Eric and Wendy Schmidt Data Science for Social Good fellows at the University of Chicago. This summer, we’re spending 14 weeks helping the World Bank Integrity Vice Presidency (INT) use data to detect collusion, corruption and fraud in development projects. We’ll use examples from our work so far with INT to demonstrate the important steps needed to assemble an effective data science project.
Even if you are not a data scientist, you are probably wondering about the tools and approaches needed to start using data science. Below, we outline four steps (and how-tos) for getting started with data science.
Step 1: Set A Goal
Like any other project, setting a goal is key for data science projects.
Your goals may vary. As a project manager, what are you hoping to accomplish by looking at your data? Do you want to showcase the impact of your project to funding partners? Do you need to decide what to do next? Do you want to improve existing practices?
The World Bank Group provides loans to developing countries so that they can finance investments in infrastructure, health, and environment sectors while boosting economic and social opportunity for the poor. While managing these loans, client countries post RFPs (requests for proposals), to solicit and receive bids from contractors.
Occasionally, during the bidding and billing process, companies may engage in corrupt behavior. Misconduct is revealed via whistleblowers’ complaints and/or the proactive work of contract supervisors and investigators that identify red flags. With the help of the Eric & Wendy Schmidt Data Science for Social Good Summer Fellows, the Group would like to take a more data-driven approach to achieve two goals:
- Develop a methodology to prioritize complaints filed by whistleblowers based on data science applied to historical records of past World Bank-financed contracts and investigation outcomes.
- Support the proactive work by World Bank staff in identifying red flags in high risk projects
In order to begin working towards these kinds of goals, a data science team will first examine the current processes and get a clear picture of the data landscape. For example, how many contracts are typically awarded, or how are the contract amounts are distributed (that is, how many contracts are awarded for $100,000, how many for $200,000, etc.)? Further, do the amounts and numbers of contracts vary based on geographic location? What are the salient data features of successful investigations?
To start a data science project, take a look at what resources you already have available. What data do you have? Do you have access to spreadsheets, databases, case management or Sales Force systems? All of these are good sources of data! Do you know an IT-professional or computer scientist? Someone with programming or technical skills can be a great resource as you start looking at your data. Keep in mind that you just need a few resources to get started with data science. Here are some examples of resources that you might be able to find: Open Data Corporate or proprietary data People Software Exploring the data is a very crucial step in any data science project. Often, the data for a real world problem is messy and does not immediately reveal insights about specific hidden attributes pertaining to the data science problem. Data exploration helps data scientists dig deeper into data by visualizing it in different ways (tables, charts, etc.). It also helps with understanding domain-specific patterns that a data scientist may or may not be aware of. For example, in the World Bank DSSG project, we looked at the contract data set, which contains approximately 200,000 records spanning from years 2000 to 2014. The figure below shows the development projects for which work was contracted occurred in 168 countries around the world. These contracts were awarded to suppliers from 198 different countries. In 76% of cases, the contract was awarded to a supplier local to the borrower country. This proportion varied across the different borrower countries in the data set. The large majority of contracts awarded in South American countries went to a domestic supplier, while the proportion is lower in African countries. Once you know what information your data contains, you can start digging deeper. While the raw data points that are recorded in your data sets may be useful on their own, there are often interesting ways to combine different data points to develop additional insight. For example, data lists may include the dates on which each contract was awarded to a particular company at the conclusion of the bidding process, as well as the date on which the contract was officially signed by that company. We wondered whether a significant delay between these two events might indicate suspicious activity. To investigate this, we calculated the difference between these two data fields, and discovered that a long delay between the date a contract was awarded and the date the contract was signed was a feature of some substantiated investigations and therefore a possible indicator of corruption. As another example, we compared the available data about contract values with data about the total budget of each development project. Considering whether a contract made up a significant portion of its parent development project provided a scale for the relative monetary importance of that contract. We also wanted to learn more about the companies that were participating in development projects. The raw data set didn’t provide any link between contracts awarded to the same company over time. By searching the data for all of the contracts involving a given company, we could discover trends in the historical behavior of that company. Did it work primarily in the agricultural sector or the financial sector? Did it work in multiple countries? As you look to expand the power of your own data sets consider the ways that you could combine different aspects of the data. Can you draw on data from two or more different sources? Can you learn something about the historical trends in your project? After you have explored your data and generated some calculated fields, like those aforementioned, you can move on to using this data to make models which will allow you to make your existing processes more data-driven and streamlined. For example, in our project with the World Bank Group, we built data models that could use data about contracts and previous investigation outcomes to prioritize whistleblower complaints about potential fraud, corruption and collusion. We developed a methodology that could not only prioritize complaints, but also provide justifications for the prioritization. This methodology will help the World Bank Group more efficiently pinpoint fraud and collusion in their contracts — allowing them to devote more of their resources to supporting the developing world, rather than searching for wrongdoing. Though our project is part of a formal relationship with the World Bank Group (now in its 2nd year!), similar steps, tools, and approaches can be used by other aspiring data scientists, whether an independent individual curious about a particular social issue or an employee looking for new ways to improve their company’s work. With plenty of free resources, software, and data available, now is a great time to find out what data science can do for you.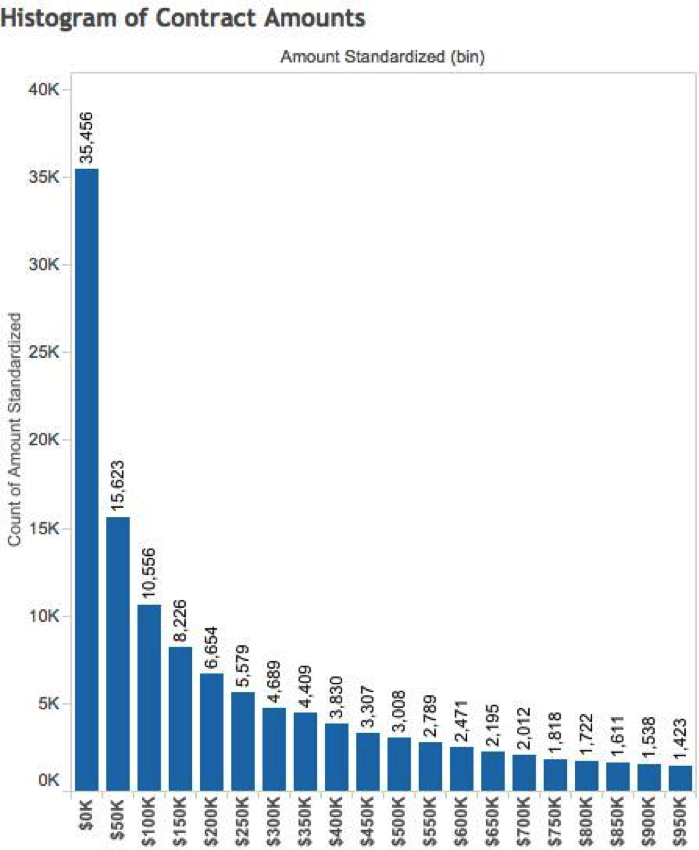
Image 1: Number of Contracts in Each Amount Range ($0-$50,000; $50,001-$100,000, etc.)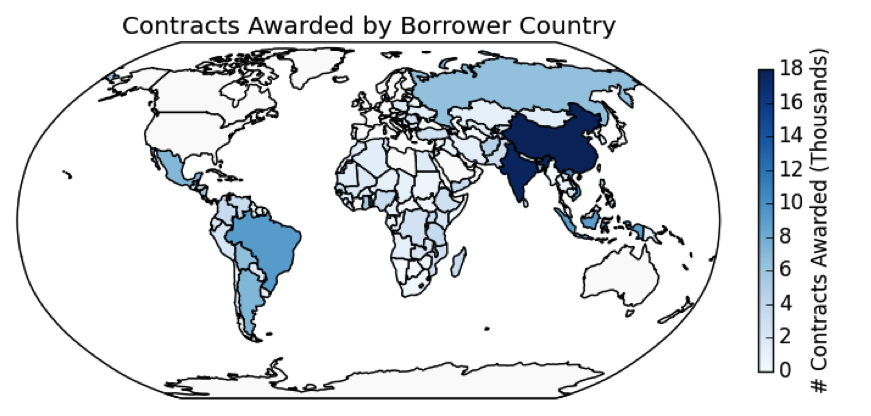
Image 2: Heat Map of Contracts Awarded To A Given Country. [Created with Python (Pandas and MatplotLib)] Source: World Bank Group Open Finances DataStep 2: Compile Your Resources
(You only need one person – yourself – to start your project, but this list suggests folks who might be good teammates or helpful resources)
Step 3: Explore Your Data
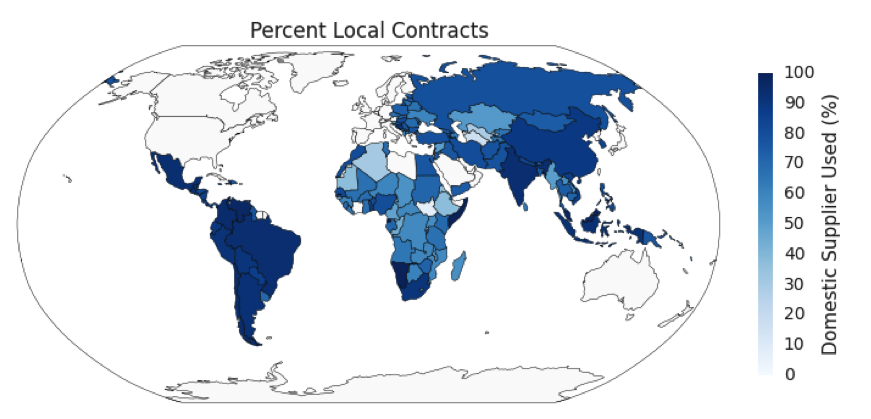
Image 3: Percent of contracts awarded to a supplier from the same country. The darker coloring of South America indicates that many local suppliers are awarded contracts in this region. In Africa, the lighter coloring indicates that many foreign suppliers are awarded contracts by African countries. [Created with Python (Pandas and Matplotlib)] Source: World Bank Open Finances DataStep 4: Get More Out of Your Data