
What’s So Smart About a Smart Meter?
Smart meters are an integral unit of smart grids, technology hailed as the future of energy management. Replacing standard meters that are read in person once a month, smart meters transmit information directly to utility companies and collect higher quality data at short intervals of time.
For utility companies, the value of these new meters is obvious — saving money on meter reading and allowing them to closely monitor and manage their system’s supply and demand. The value for consumers is just as impactful. With smart meters providing deeper insight into their home energy use, the opportunities to increase energy efficiency, thus saving money and resources, are boundless! But to unlock that potential, the aggregated data collected by smart meters must be decoded, a process referred to as disaggregation.
Aggregated information, the total amount of electricity consumed by a residence during an interval, is helpful in comparing energy use among neighbors and evaluating daily patterns. However, it does not reveal information about individual appliances within a residence, such as which appliances are on at each time, and how much energy is being consumed by each.
This summer, our team is creating tools which will help bridge the gap from single point sensor information to disaggregated appliance signatures. To accomplish this, we are working with several partners, including Pecan Street, Elevate Energy, and the Village of Oak Park. We want to understand the problems these organizations face, and to provide tools which not only address these problems but which create replicable and scalable solutions.
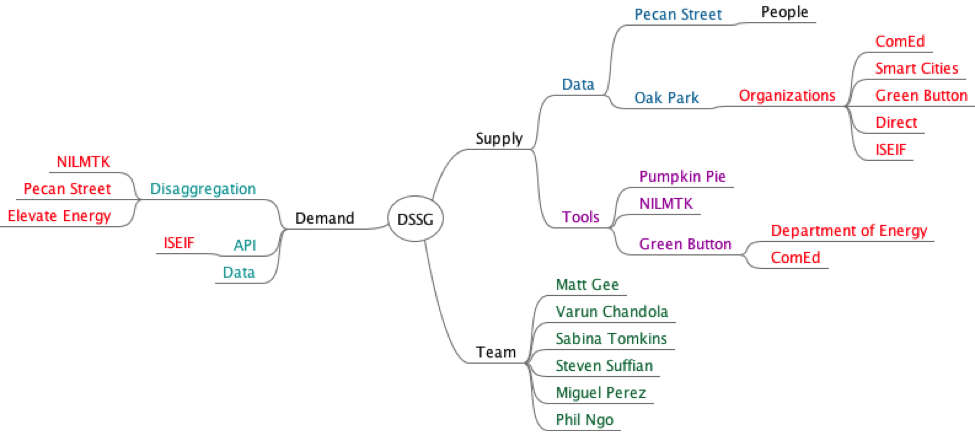
Below is a graph of the partners involved in the project. All partners are interested in providing consumers with information to make educated choices about energy use. Those on the supply side have provided tools or datasets to the fellows, while those on the demand side would benefit from tools that positively impact energy management. Organizations are in orange, datasets are in blue, problem solving approaches are in turquoise, tools are in purple, and people are in green.
Untangling the Symphony of Appliances
We are currently working on developing a framework to make it easier to test different disaggregation techniques. So what is disaggregation anyway?
Your home has many electrical subcircuits, but utilities companies only need one meter reading to bill you on energy usage. However, people trying to be energy efficient want to know an energy breakdown by appliance, so they can see which appliances use the most energy. Load disaggregation attempts to use the single reading from your meter to figure out how much each appliance contributed to that reading. Here is a simple example:
Let’s say on Monday morning at 7 am your toaster is using 2 watts, your waffle iron is using 3 watts, and your air conditioning unit is using 20 watts. If you already know each of these wattages, aggregating is easy; adding each power reading together shows that, in total, you are using 25 watts. However, a smart meter only measures the aggregate use of the home, 25 watts, so disaggregation is necessary to determine the wattage used by each appliance. Disaggregating is much trickier than aggregating; maybe the 25 watt reading came from one appliance using 10 watts and another appliance using 15 watts, or maybe it was five appliances using 5 watts each.
To disaggregate smart meter data there are two major components that we will need to accomplish for each home. We first must decide which appliances are within a household. While we will attempt to directly ask these questions to homeowners, we will also use some machine learning techniques to detect the existence of an appliance. The second component is predicting the amount of energy used by each detected appliance.
We are currently exploring three different techniques for energy disaggregation: Neural Networks, Hidden Markov Models, and Sparse Coding. We are training each of these models on energy data provided by the organization Pecan Street and will then apply the trained models to disaggregating single point energy data from residents in the village of Oak Park.
Different Approaches for Disaggregation
There is no right way to go about disaggregating meter data. Here are some of the insights that inspired the approaches we are using:
Different appliances use different levels of power – sudden surges in power use can signify an appliance turning on.
This is the insight that sparked the time sampling (also called event sampling) approach. Time sampling looks at the jumps in power levels between two time intervals. This method works best when the intervals are very small, such as one second. The first task is to look for big jumps, for example 0 – 200 watts. Then, the question is to decide which appliance could have contributed to such a jump. If you want to learn more about this approach, here is a paper about event sampling and load disaggregation. As our data is only sampled every 15 minutes, this algorithm is not a priority for testing.
The power used at one point in time is related to the power used at the previous point in time.
Hidden Markov Models use this assumption. By having some information about the probability of one variable transitioning from one state to another, and knowing the probability of a variable beginning in a certain state, a Hidden Markov Model can guess if a variable was on or off at a certain state. To use such a model with no other information about appliances would be pretty impossible, but with another insight you can do it!
Two appliances of the same type will use similar amounts of power.
Using this insight you can build representative models for an appliance type. For example, while refrigerators in ten different homes may use slightly different amounts of power, their signals will be close enough that a general model can be made for a general refrigerator power signal. This model can then be used to predict the power signal for a refrigerator in an 11th home. Or, given a signal in an 11th home, the model can be used to decide what part of the aggregated signal can be associated with a refrigerator.
Appliances of the same type have similar usage patterns over the course of a week.
This is the basic assumption of a model called discriminative sparse coding. One assumes that the power signal of a given device type (e.g. refrigerator) is a sparse combination of underlying signals specific to that device type. Thus one can use training data to learn these underlying signals (called basis functions). Presented with data for a new home, the model seeks a sparse activation matrix to explain how the devices in this particular home relate to the previously learned basis functions. For more details, see this paper by Batra, Kolter and Ng.
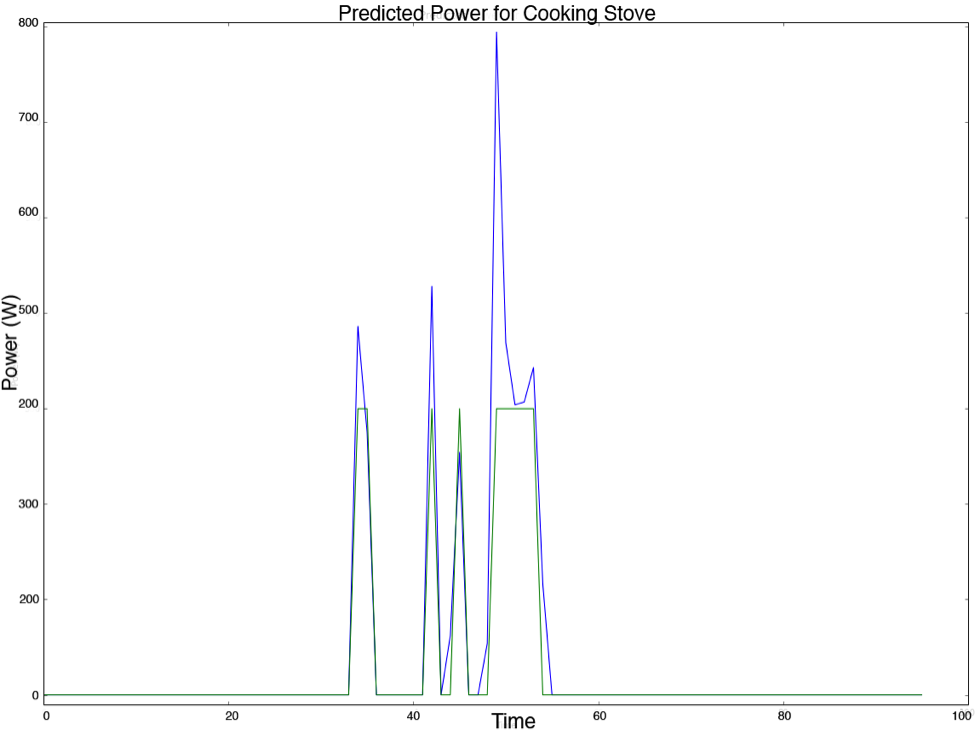
So far we have tested Neural Networks and Hidden Markov Models. Below you can see the results obtained from a Hidden Markov Model. The blue line shows the amount of power used by a stove over the course of a day, and the green line shows the amount of power predicted by the model. As you can see the pattern is detected reasonably well, though the scale is not perfect.
Going forward we will continue to develop disaggregation methods and are very excited to test them in Oak Park! Check back for more updates!